Dear readers, I always try to express my thoughts, views and opinions in the shortest possible manner, this is my writing style and I have no intention to waste your reading time. As I see the situation the gold market continue to present a unique opportunity for high reward low risk investment , please review the archive of this site for information regarding the HUGE outstanding short positions. (An easy way to find this information is searching "Gold Short positions" using the Google search box at the left of the page , another way is browsing through the archive)
The short positions along the stagnating global gold production are among the main internal factors which drives this great gold bull market.
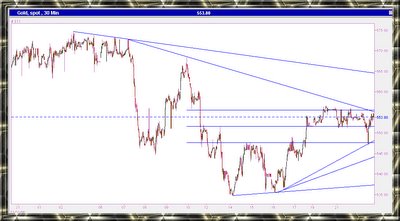
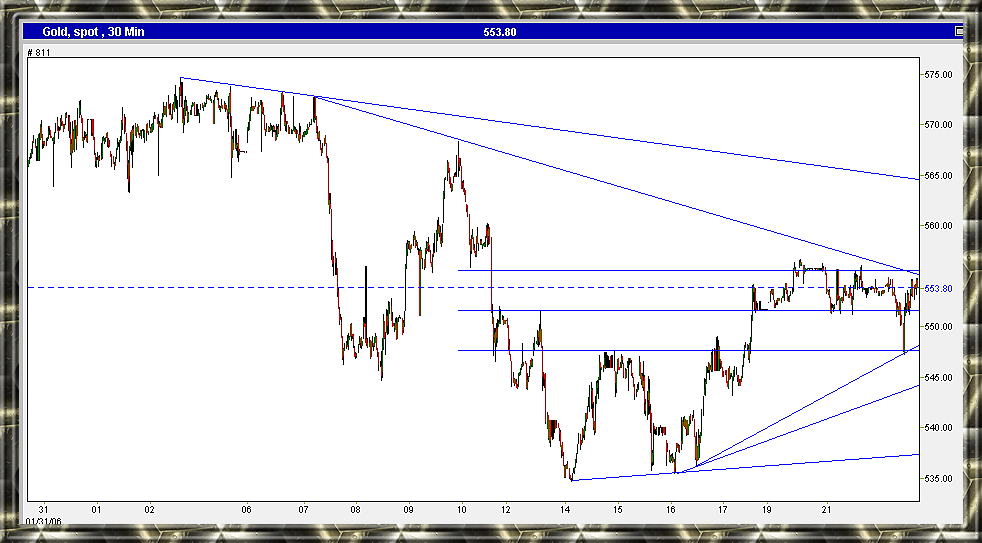
Today gold traded down to the 38% Fibonacci line then got back up to the 62% line, purely technical move, a pattern of symmetrical triangle is forming on the intraday chart and a breakout one way or another should soon follow. If I had to make a short term bet (which I don’t have to) I would cautiously bet on a breakout to the upside.
Click on the chart below to enlarge:


2 comments:
Thanks for leaving a comment on my blog.
I'm curious what you think about the long term trends of precious metals.
I will soon review some long term charts for gold and silver.
please review the archives as I have posted some long term charts and market analysis before...
Alos, see my other site for platinum,palladium and other commodites charts:
commodities charts
Post a Comment