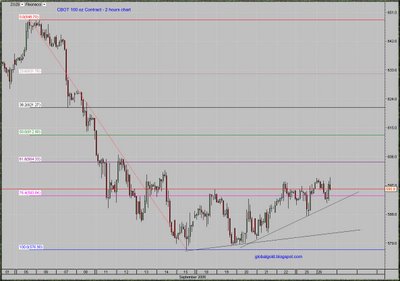
If gold will find it way up sooner then later and the 570's USD levels will prove to be an important secondary bottom then the Fibonacci lines on both Spot and Futures gold charts will act as short term support and resistance levels. I'm posting these two charts annotated with diagonal minor uptrend lines.
For
GDX, HUI, and XAU – Fibonacci levels, refer to these posts(You can click on the charts for larger view)


3 comments:
Your blog keeps getting better and better! Your older articles are not as good as newer ones you have a lot more creativity and originality now keep it up!
Somebody essentially help to make seriously posts I would state. That is the very first time I frequented your website page and up to now? I surprised with the analysis you made to make this actual post incredible. Fantastic activity!
Great website. A lot of useful information here. I¡¦m sending it to several pals ans also sharing in delicious. And certainly, thanks to your effort!
hi!,I like your writing very much! share we be in contact extra about your article on AOL? I require an expert in this house to resolve my problem. Maybe that is you! Taking a look forward to look you.
of course It's me! LG
Post a Comment