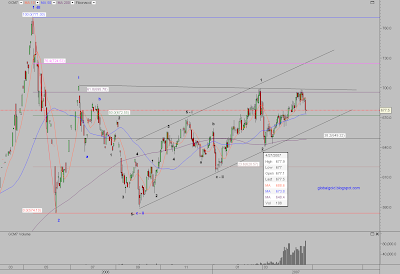
So far June COMEX gold contract failed to exceed its late February high (~699$) while spot gold managed to trade above the same cyclical high. The contango is taking its toll.
XAUUSD Intraday Chart (4 hours candles). Annotated with Fibonacci levels and Elliott wave count ( wave 4 underway). As posted before; ~667$ spot remains target before heading higher.

GCM7 - COMEX Gold June contract daily chart. Annotated with Fibonacci levels and Elliott wave count (wave iii blue underway). Note support at ~672$, just below the 50% Fibonacci line.

- As explained before, take any of my posts in the right time frame context.
- I observe and estimate that the price of gold is constructing an Egg pattern which requires extremely high degree of patience.


2 comments:
Hi!
Nice charts ...
Thanks you! , check back often as more charts will follow …
Post a Comment