


I have tried to warn you in the several last posts and I hope that at least some of you took profit on speculative short term positions.
Long term positions should not be affected at all and anyone should be aware that those steep and sudden sell offs will repeat from time to time.
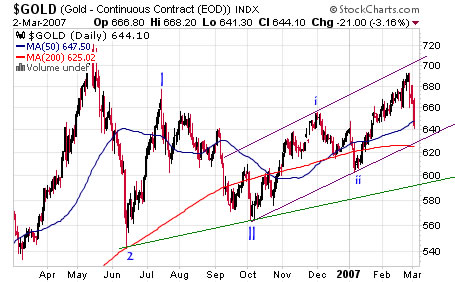
As you can see on the short term gold chart below - gold is retracing its 2007 advance. The price of gold is already down about 50$ from the latest top. Gold closed the week below the 50% Fibonacci line and the 50 days moving average. Don’t be surprised to see more short term downside, Pay attention to the 200 days moving average and the 76.4% Fibonacci level.

Looking at the one year chart, note that the price of gold is still inside the uptrend channel. The channel which begun at October 2006 is valid but it is not as meaningful as this year low (labeled ii). There is one more noticeable uptrend line connecting the June and October 2006 lows.

1 comment:
This has not been proven i am a scientist and this is not true!
Post a Comment