Tuesday, February 28, 2006

Gold and Silver charts

Today Gold and Silver moved higher while the gold and silver stock indices declined along the general US stock market. In the past it was a sign of a coming weakness for the metals but that should be changing as investors might be changing their preferences for obvious reasons.

See also: Special risks when investing in a mining company.

Click on the charts below to enlarge:

gold spot chart
silver spot chart

Monday, February 27, 2006

Gold two hours chart

Gold and silver lost some ground today, let's see what happen tomorrow.
Meanwhile I'm trying to think about what will be a fair price for gold under current conditions, one of the main issues regarding the price of gold is the fact that the gold market is both a physical and paper market and this fact is a very important one.

click on the chart below to enlarge

Sunday, February 26, 2006

Long term gold charts

Gold rallied to new highs for the week, moved above the 62% Fibonacci blue line and stopped just below the 62% Fibonacci green line. There is still some upside resistance to fight on the way up but the pattern on the chart is orderly bullish and higher highs should be expected , it is now clear that gold had double bottomed around 535$.
Silver first traded hesitantly then followed gold and gained nicely, the days of single digit silver will soon be history.

The gold and silver markets simply present an extremely high reward low risk Investment opportunity. In the long term I expect the price of gold and silver to multiple several times, gold can easily reach four digit figure and possibly 5 figure, while silver can reach high double digit and possibly low three digit figure.

See the hedge book report for detailed analysis regarding one segment of the short gold positions. click here to open the report in a new window.


Click on the charts below to enlarge:


gold spot chart


long term gold chart

gold fix longterm chart
Feel free to quote, copy or link.

Thursday, February 23, 2006

Gold Intraday Chart

Gold pulled back today and is currently trading just above the 38 Fibonacci line, not a big deal if you ask me. The triangle formation is still constructing itself and technically the short term situation is somewhat unclear. This week gold traded in a relatively narrow range of about 10$ and it seems like the 550$ level perceived as acceptable between the buyers and sellers. I assume that the tight trading range caused the speculative players to temporarily leave the market and a bit of more consolidation will be healthy. If you are looking for other speculative ideas check out John Rubino latest commentary.

Silver continue to trade very similar to gold both in terms of direction and tight trading range. The last couple of weeks the general commodities market corrected nicely and current levels should be seen as buying opportunity , see the CRB chart here.

Click on the chart below to enlarge:

gold price

Wednesday, February 22, 2006

Gold 24 hours chart

Dear readers, I always try to express my thoughts, views and opinions in the shortest possible manner, this is my writing style and I have no intention to waste your reading time. As I see the situation the gold market continue to present a unique opportunity for high reward low risk investment , please review the archive of this site for information regarding the HUGE outstanding short positions. (An easy way to find this information is searching "Gold Short positions" using the Google search box at the left of the page , another way is browsing through the archive)
The short positions along the stagnating global gold production are among the main internal factors which drives this great gold bull market.

Today gold traded down to the 38% Fibonacci line then got back up to the 62% line, purely technical move, a pattern of symmetrical triangle is forming on the intraday chart and a breakout one way or another should soon follow. If I had to make a short term bet (which I don’t have to) I would cautiously bet on a breakout to the upside.


Click on the chart below to enlarge:

gold spot chart

Tuesday, February 21, 2006

Gold spot intraday chart

Dear readers, some of the Gold and Silver mining companies have reported their 2005 – Q4 results recently, I have made a few review posts about the major interesting stories. Amazingly the picture is very simple: as the price of gold goes higher the heavily hedged miners actually report declining profits. While Un hedged or little hedged companies report higher profits. See the reports here:
I did not see any news regarding the gold and silver market. I continue to see way too much disinformation and the usual terror, dollar, bird flu pseudo explanations. If you want to have at list a clue of how the gold market is working ignore all the usual professional analysts' explanation and concentrate on the price action.
It is very silly to think that a bunch of terrorists can control the price of gold.

Gold is currently trading just between the 61.8% and 50% Fibonacci retracement levels (the short lines - pink set). Silver action is exactly the same like gold.

Click on the chart below to enlarge


gold chart

Sunday, February 19, 2006

Gold Chart

As appears on the daily chart below gold short term trend is still up. The channel is still intact and the price of gold is close enough to the bottom of the channel, the top of the channel is currently above 600$ and raising. I cannot guaranty that the eight days or so correction is over but it appears that the bottom of the channel, the Fibonacci retracement lines, the 50 days moving average and 2005 highs gave enough support for the price of gold to bottom and reverse.

Click on the chart below to enlarge:

gold chart

Friday, February 17, 2006

Silver ETF

This is what the Silver Users Association say about the subject :

Silver Market
Between 1966 and 1970, U.S. Treasury sales of silver were a major secondary source of supply. Because silver had been a U.S. monetary standard along with gold, the U.S. government held the world's largest source of secondary supply in an effort to meet a growing production/consumption deficit. In 1965, it appeared that in less than two years the Treasury would effectively lose control of the price of silver. If silver had been allowed to rise above $1.40 per ounce, the silver content of U.S. coins would have been worth more than their face value, causing them to disappear from circulation. Under the Coinage Act of 1965, Congress eliminated the use of silver in coins and authorized the mining of cupro-nickel substitutes and the sale of silver to the public. The right of holders of U.S. silver certificates to redeem them for silver was suspended in 1968. The following year, a federal ban on the melting of U.S. coins was lifted, freeing anywhere from 400 to 700 million ounces for secondary recovery.Read more...

And the report here

India Gold mutual funds

First China, now India.

ASHISH GUPTA

TIMES NEWS NETWORK[ FRIDAY, FEBRUARY 17, 2006 12:22:33 AM]

Gold mutual funds may soon be a reality in India. Securities and Exchange Board of India (SEBI) has cleared the way for introducing gold exchange traded funds (ETF) in the country.

It has approved two models for launching the product – a mutual fund custodian bank integrated model and mutual fund warehouse receipt model. These two models were earlier recommended by a SEBI-appointed committee.

Under the mutual fund custodian bank integrated model, the physical gold will be held by a custodian bank on behalf of the mutual fund. The mutual fund sells or buys units to a wholesale intermediary based on the value of the gold with the custodian bank. These units will then be traded on stock exchanges and retail investors could buy them from the wholesale intermediary.

As against this, in case of the mutual fund warehouse receipt model, gold warehouse receipts are held by a custodian bank on behalf of the mutual fund. The mutual fund sells or buys units to a wholesale intermediary based on the value of the gold warehouse receipts with the custodian bank.
Read more @ Source: India times

Silver intraday chart & toughts

The price action of silver is very similar to gold. The fundamentals behind the bull markets in silver and gold have much in common but each metal is having its own advantages & disadvantages. One can make good arguments of why silver is a better buy then gold and visa versa. Nevertheless, I don’t want to get into this argument and would just like to suggest that both will perform remarkably well this calendar year – regardless of the Forex market. I mean that in this stage of the bull market the action in the gold and silver markets is becoming less and less dependent on the action of USD / EURO, USD / YEN … ETC. Gold and silver are distinguishing themselves vs. the rest of the currencies. It’s about us and them situation: on one side you have the millenniums old, forgotten, natural Forex, on the other side you have the experimental, politically managed, local seignorage currency. This fact is best seen through the increased volatility in the price of gold and silver. In addition the correlation in the exchange rate of gold and silver in different paper Forex is much higher then before. For example there is not much difference in the chart pattern of Gold in Euro or Gold in USD. So the point is: it is important to track both gold and silver even if you just invest / trade / speculate in one of them.

Click on the chart below to enlarge:

silver chart

Thursday, February 16, 2006

Gold and silver commentary

It is yet to be seen if gold and silver already bottomed or is another wave of selling coming? , this week lows are the key answer. A climb above this week highs will almost certainly confirm the bottom while a slide below this week lows will indicate another wave of selling could be expected. Caution is advised for those holding margined positions, while those who have no position can start accumulate averaging up or down, it will not be long before new multi years highs are made – this is my opinion. Those holding a short position should be aggressive buyers at current levels. The Increased volatility in the price of gold is a bullish sign and we are probably going to see huger intraday price movement, once market forces realize that gold and silver are not going lower and the bottoms are in, expect some kind of shorts capitulation which will propel gold to above 600$ and silver to above 10$.


chart gold

Tuesday, February 14, 2006

Gold charts

Some nice recovery for the precious metals today, gold and silver are currently 12$ and 0.25$ above last bottoms, there is a good chance the bottoms are already in. According to my E wave count for gold this is a third wave within a bigger scale third wave up, third waves are known to be confusing and this is exactly what I see in the market – confusion and allot of it. Some "professional analysts" are calling for 2000$ per oz gold price while others are talking about 450$. You can read all kind of pseudo explanation of why the price of gold is going this way or that way. This confusion will certainly help gold to go (a bit?) above 1000$ in 2006.
I have already explained a lot about the main drivers behind the price of gold, so please review the archive for more information.


China hungry for gold
14:25:23 GMT, 14 February, 2006
Shanghai Gold Exchange president Wang Zhe believes that China could become one of the world's biggest gold importers.

The country's gold trading volume increased by 36 per cent in 2005, and Mr Zhe said China "has the potential to be one of the biggest gold markets in the world," according to the Financial Times.

His views are supported by recent consumer spending in the world's most populous country.

The Old Phoenix jewellery store in Shanghai has been selling a large number of $2,000 gold bars embossed with the Beijing Olympics logo.

A salesman said that "there will be a new bar every year until 2008 and many people want the complete set".

The situation is vastly different from even a few years ago – up to 1982, individuals in the country were not allowed to own gold.

However, the country is now poised to become a significant gold importer.

"Commodities will have a strong investment case in the year ahead because of the strong Asian growth," said Michael Hartnett of Merrill Lynch.

Gold in particular has a strong case as global growth gains momentum in the second half of 2006. source: World Gold Council www.gold.org

Click on the annotated charts below to enlarge:

gold chart
gold price

Send it to your central banker...

England Wins Again: First In The Great Gold Selling Game
Date: February 14, 2006
By Our Man In Oz

It’s not every day that the people of Australia are prepared to doff their Akubras and say: “well done England, you win again”. After recovering from the shock, and quickly checking the back pages of the Telegraph to see if a cricket or rugby test was played overnight, a tiny little warning bell tinkles in the distance. Ahh, it’s those damned Aussies having a bit of fun, isn’t it? Yes, comes the confession, it is in fun, but fun to the value of around £1.5 billion – which is roughly the “winning” gap between how much Gordon Brown has cost British taxpayers by selling gold too cheaply, and how much his Australian counterpart, Peter Costello, has cost Oz by doing the same thing.

Experts will argue about the precise numbers in this game of who lost most but, one thing is absolutely certain, both Britain and Australia played a dumb game in the 1990s when they abandoned gold for a fistful of interest-bearing dollars, euros and yen. In fact, if there is to be an argument over the numbers it might be worth digging into precisely what interest rate the Bank of England and the Reserve Bank of Australia (RBA) actually got from re-investing the proceeds of their gold sales. What might have looked attractive in 1997 when Oz sold, and the three year period between 1999 and 2002 when the U.K. sold, would have been very unappealing when Japanese and U.S. treasuries dropped to 1% -- and less.

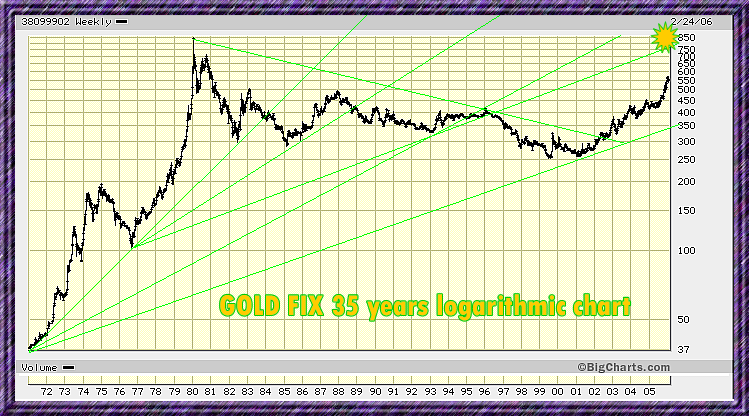
For the record, the great gold game was kicked off by Australia in July, 1997, when the RBA stunned the local goldmining industry by announcing that it had sold two-thirds of its gold holding, slicing the stockpile from 247 tonnes to 80 tonnes. The exit was stealthy, with all of the gold sold over a six month period without anyone outside the walls of the RBA’s headquarters in Sydney’s Martin Place told about the dramatic shift in national financial reserves. When the sales were announced it was fait accompli. The prices received were said to have varied from US$335 an ounce to US$360/oz, with the average assumed to have been US$350/oz.

Costello glibly told the world that “gold no longer plays a significant role in the international financial system”. Adding that Australia actually had large reserves of gold in the ground, and was digging it up as fast as it could. The gold industry branded it an act of treachery against what was then Australia’s second largest commodity export. Rob de Crespigny, then head of Normandy Mining, described the sales process as “clumsy”, adding that gold had to be treated as a long-term investment. De Crespigny capped off his criticism by pointing out that when the RBA made its sales announcement it did not even appear to understand the effect it would have on the gold price – which fell sharply in the weeks after. “If they were real pros they would have sold and bought back at the lower price,” he said, a suggestion which highlights to difference between a central banker and a businessman.

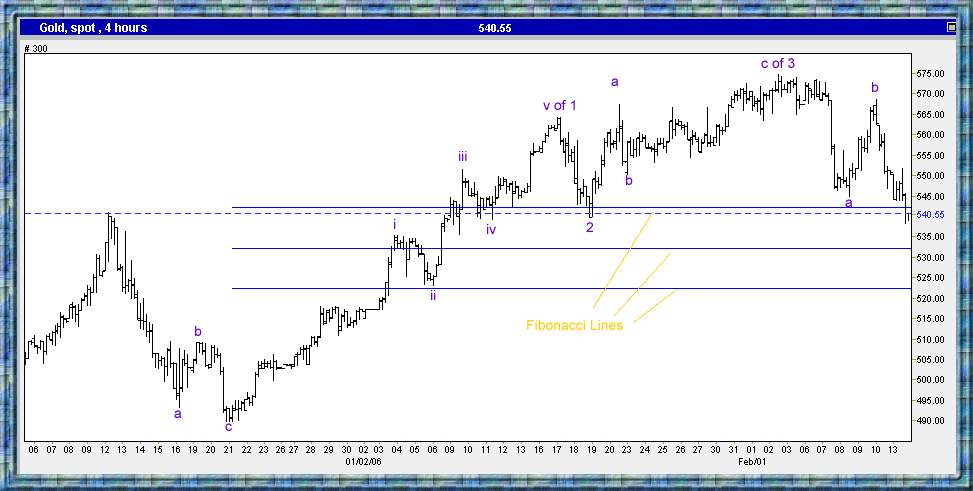
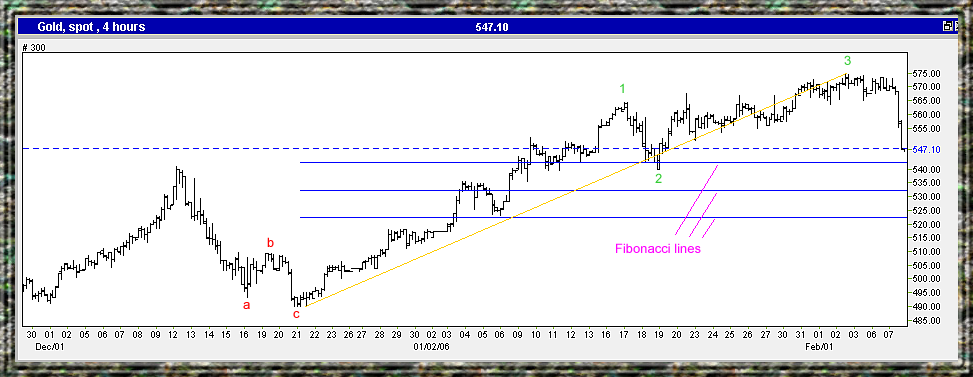
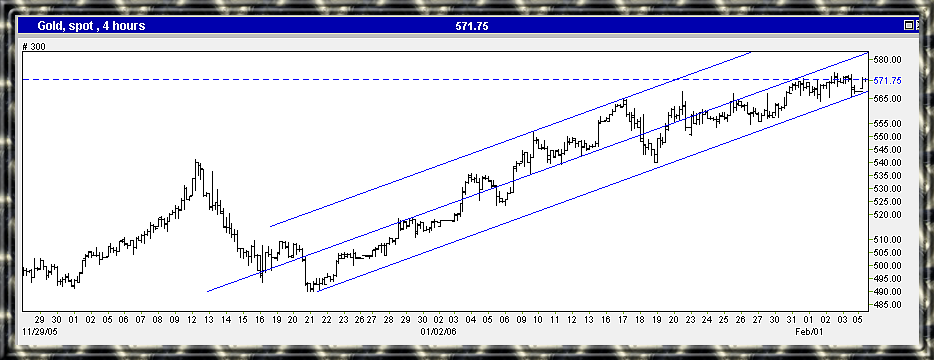
Brown, apparently a phantom admirer of the righter-than-right-wing Costello, was a willing subscriber to the gold sales policy, slipping 395 tonnes of the U.K.’s gold into the market in 17 auctions at prices which started at a truly pathetic US$254/oz – the absolute low point in gold’s 20-year cycle. Over the course of the auction process the average price received was an unprincely US$274.90 which, for the amusement of all, is spookily close to being exactly half the current would gold price.

The point about all these numbers, and to look back on what was the obvious folly of the gold selling programme, is to achieve two objectives. Firstly, how much out of pocket are both countries, and secondly: who won. In terms of dudding its taxpayers you have to say the U.K. is a clear winner. An estimate of the gap between what was fetched in the sales and what the Bank of England’s gold would be worth today is around £2 billion. The gap between what Australia got and what it would be worth today is about A$1.5 billion – when boiled down at current currency conversion rates you arrive at the U.K.’s “winning” score of roughly £1.5 billion.

Defenders of the gold sales policy will argue till the cows come home that they were right, and all they were really doing was obeying Lord Keynes, the man credited with dubbing gold a barbarous relic in 1923. True believers in gold will listen to this, feel annoyed, and then burst out laughing because the score in the great gold game is there on the board for all to see. Brown has cost his taxpayers around £2 billion, Costello has cost his around £500 million – and that’s after allowing for earning a reasonable amount of interest on the gold sales proceeds.

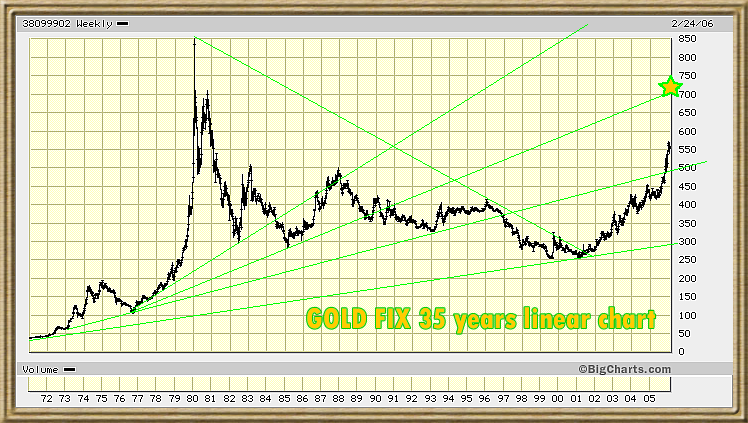
Perhaps the key question of all is whether the gold sales actually achieved their primary objective and strengthened the financial backbone of the two countries. The answer to that is a resounding no. Not only are the gold sellers poorer, they have achieved nothing by swapping a hard, physical, asset for a piece of paper backed by a rival central bank in some other country, a process of paper-swapping which might make for a bit of serious academic study one day because the paper-swap process lacks any semblance of the stability and permanence which comes from gold. Presumably someone has whispered in Mr Costello’s ear that gold has just touched a record level in terms of Aussie dollars. Minews has tried to point it out to Mr Brown, but as well as being blind in one eye , he also appears to be deaf.


Source : minesite.com

Monday, February 13, 2006

Gold Intraday chart

Gold and silver headed lower today below last week lows, gold is already about 35$ below it recent top currently trading around the 2005 high level. This pullback might have another leg down but I wouldn’t bet on it. I continue to see excellent risk reward opportunity in buying gold and silver , the higher risk is on the short side of this market and the appreciation potential is much higher then the total price of gold or silver. Physical buyers, long term buyers and those holding short positions should take advantage of the market weakness and accumulate; short term traders could probably wait a bit longer for a bottom confirmation. I have annotated a four hour gold spot chart with Fibonacci levels and Elliot wave count.


Click on the chart below to enlarge


Gold Intraday chart

Saturday, February 11, 2006

Cheuvreux gold report

Paul Mylchreest (investment analyst, Credit Agricole Cheuvreux International) published an impressive gold market report covering some of the complex fundamentals driving this great gold bull market. It appears that the disagreement (regarding gold role in the global monetary system) is expending itself from the central banks arena into commercial banks arena as well.

If the findings about central banks gold lending are true, the immediate conclusion would be: some central banks have been providing huge subsidy for commercial banks on the expense of their public. Doing so, not only severely mismanaging public funds under their supervision but also causing great damage to usually poor countries heavily dependent on gold export.
Please read the report here.

Friday, February 10, 2006

Gold / Oil ratio

Not so good action for the precious metals complex today, Gold and Silver are trapped in a relatively tight trading range between this week highs and lows. However, the gold oil ratio made a one year new high on a closing base. I see a pattern of inverted head and shoulders on the gold / oil ratio chart. I'm not an oil bear so if an average crude oil price of 60$ is assumed the initial target for gold according to the pattern would be about 681$.

See my other web pages for charts and information regarding:

Commodities

Gold and Silver stocks


Click on the chart below to enlarge:

Gold / Oil ratio

Thursday, February 09, 2006

Gold spot one hour chart

Gold and silver Recovery is almost as sharp as the correction. The violent down move was clearly non sustainable and counter move quickly followed. If you trade this market using margin use it very wisely if any. As the bull market continue it is very logical to expect similar moves and even more volatile market. Gold outperformed both the XAU index and the HUI index today, in my opinion it is not a sign of weakness but a possibility that investors preferences are changing and the metals are set to outperform the stocks , time will tell…

Click on the chart below to enlarge:


gold spot chart

Special risks when investing in a mining company

Indonesia seeks revised Freeport-McMoRan profit-sharing deal

South Africa Gold output dropped 12.8% in 2005

The country's gold production in 2005 declined by 12.8 percent when compared with 2004, Statistics South Africa said on Thursday.

In the three months to December 2005 gold output fell by 8.8 percent when compared with the three months to December 2004.

read more

Wednesday, February 08, 2006

Gold & Silver daily channel charts

I have annotated both gold and silver 6 month daily charts with channels and Fibonacci retracement levels. Click on the charts below to enlarge:

gold chart
silver chart

Golden Thoughts

There are different kinds of groups in the gold market and the price of gold reflected in the gold charts is simply the history and present relationship resolving between them. Do not try to understand every move up or down in the price of gold this is simply impossible thing to do.
As we all know the gold market is both physical and paper market, some players are just prudent investors who look for wealth protection and others are extremely leveraged speculators looking for a volatile market and quick profits.
I believe hedge funds and automated systems are also getting more active in the gold markets, needless to mention central banks, bullion banks and gold miming companies.

The most important facts you should all remember:

1) The huge short positions which will provide both fuel and floor for this great gold bull market.

2) The emerging dispute between central banks themselves regarding the gold reserves.

3)Thousands years history of gold as money.

4) Depleting gold reserves and stagnating to declining gold mining production that even the most sophisticated technology could not improve.


Click to see PAAS and NEM annotated charts

Tuesday, February 07, 2006

Violent market forces at work

It was a violent correction for the precious metals and their mining shares. Gold broke down of a head and shoulders pattern and the downtrend was consistent all day long, Silver support is around the 9.30 $ level. Gold is already 28$ lower from its most recent top and the correction is already somewhat overextended in my opinion. Nothing goes straight up and violent & volatile market should be expected, physical holders need not worry at all while futures traders should be very careful!
I have annotated one and four hour charts for gold spot. Click on the charts below to enlarge:


gold spot chart
gold spot chart

Monday, February 06, 2006

China's first gold fund may be created

Zhang Fengming
2006-02-07 Beijing Time
THE China Gold Association is considering forming the country's first gold fund with partners.

"Some association members have discussed the program to start a gold fund to tap China's gold market," Hou Huimin, vice chairman of the Beijing-based association, said via telephone yesterday. "It's still only a proposal at this stage and we have not yet contacted banks or gold companies about further moves."

The fund will exceed 1 billion yuan (US$124 million) if it is raised, he said, dismissing a previous media report that the fund would be between 500 million and 1 billion yuan.

He declined to provide a timetable or other details.

Gold's investment allure is strong as the central government has opened the individual gold investment sector with more products.
Read more...

Gold four hours chart

Dear readers,
It is my opinion that gold might be very close to a point of a sharp, volatile and violent move which will result in a price of above 600$. The Investment world finally start to recognize the extremely bullish fundamentals, the relatively huge short positions and most of all the opratunity for unusual high reward low risk "investment". This move will come regardless of any political development or Forex markets fluctuations.

Click on the chart below to enlarge


gold chart


Links:

Gold global perspective: The great Gold paradox (part II)

Gold global perspective: Gold Short positions

Sunday, February 05, 2006

Silver 8 hours chart

Nothing goes strait up , like gold, silver is building a base and consolidate before making a move that will take it above 10$, I don’t think that any pullback in the price of gold or silver is going to be deep nor sustained.

I have annotated the 8 hours silver chart with wave count, Fibonacci levels and trend lines. Click on the chart below to enlarge:

Friday, February 03, 2006

Gold spot one hour chart

Gold had some kind of pullback today, Elliot waves count suggest this is not going to be a deep correction and higher highs are just around the corner but the count is not confirmed so caution is warranted.

Click on the chart below to enlarge.

Thursday, February 02, 2006

Gold and Silver four hours charts

Yet another good day for the precious metals sector, gold , silver, platinum all made new highs while palladium had the best performance the last couple of months gaining around 50%. This is the beginning of the second wave up for the precious metals (Elliot wave 3) , the industrial metals along many other commodities are also acting very strong. Money managers and the financial industry are getting more interested in this market and the fundamentals are bullish. However this is the year of the dog and I expect gold (DOG _L) to finally get rid of its lousy image it had the last quarter century and be one of the best performance assets for 2006, not just among currencies but also among commodities.


Click on the charts below to enlarge


commodities charts: Palladium Futures (PA, NYMEX)

Wednesday, February 01, 2006

XAU – Philadelphia Gold & Silver Index

Not Much change in the gold market today, silver pulled back some but not too much.

CBOT Expands Precious Metals Complex and Launches 100 Ounce Gold Futures Options read more

Expect more of the same for the foreseeable future. New exchanges for gold and commodities will open all over the world as the sector will be more and more interesting for Investors. Long way to go...

Gold Indices have done great the last couple of month as Investors like stocks better then futures or physical stuff. I expect that to change over time and will not rule out the possibility that gold will outperform most of the gold stocks or at least the gold Indices; likewise I am not sure at all that silver will outperform gold.
In my opinion all gold and silver "Investors" should have some physical metal at hand – especially small investors.

More later – real1.


My last review of the XAU Index:
Gold global perspective: The gold stock indices


XAU – Philadelphia Gold & Silver Index

How high will gold go in 2006?

Since the second wave up started (E-wave number 3) around mid July 2005 the Gold / USD exchange rate gained around 37%. I made a short study and found that from each bottom to date the rate of change was actually faster. Simple average of all rates of change per week will give a rate of change of 1.8% per week. This is a modest estimation since the rate has proven itself to be accelerating for the past half year.

So if we simply use this rate of 1.8% per week and the remaining 48 weeks for 2006 the number we get is 1068$, this is a realistic and conservative price target for gold in 2006. As the data will accumulate I will update this study and try to give more accurate prediction.

Click on the chart below to enlarge:


gold prediction chart

Search

SUBSCRIBE

Gold Global Perspective Feed

AddThis Social Bookmark Button AddThis Feed Button

Labels