Saturday, April 28, 2007

Euro at All Time High ?

Gold & Silver gained some ground as the Euro makes a new all time high (or is it?)


The Euro was introduced to the world financial markets as an accounting currency in 1999 and launched as physical coins and banknotes in 2002.

source

As explained several days ago, pre issued Euro high was actually higher at about 1.4570$


Long term (30 years) retro perspective EUR/USD chart.

long term EUR/USD chart

Thursday, April 26, 2007

Gold Spot & Futures Charts

The USD Index hovers near decades lows, the EUR/USD pair kissed its all time high (~136.667) currently floating less then a cent below. The jury is still out as things can abruptly change on a penny or less…

So far June COMEX gold contract failed to exceed its late February high (~699$) while spot gold managed to trade above the same cyclical high. The contango is taking its toll.

XAUUSD Intraday Chart (4 hours candles). Annotated with Fibonacci levels and Elliott wave count ( wave 4 underway). As posted before; ~667$ spot remains target before heading higher.

XAUUSD Intraday


GCM7 - COMEX Gold June contract daily chart. Annotated with Fibonacci levels and Elliott wave count (wave iii blue underway). Note support at ~672$, just below the 50% Fibonacci line.


COMEX gold


  • As explained before, take any of my posts in the right time frame context.
  • I observe and estimate that the price of gold is constructing an Egg pattern which requires extremely high degree of patience.

Wednesday, April 25, 2007

Educational Gold Trading Video Collection

Educational Gold Trading (or related) video collection.

Video wall by Blinkx.


Thanks for all video contributors, send me video links for inclusion consideration.

Market updates and charts will be posted as needed.

Tuesday, April 24, 2007

Update

Quite but tensioned trading as the US Dollar index is very near to historical lows (see USDX pattern target) and the EUR / USD pair is 100 pips below the all time high ( I'm referring the high of the actual Euro , theoretically – pre issued EURO was actually higher). Silver continue to lag behind gold, HUI & XAU pulled back slightly.

In depth look at HUI & XAU.


That’s all for now...

Friday, April 20, 2007

Five Interesting Blogs for the Weekend

Wednesday, April 18, 2007

COMEX GOLD (GCM7)

Dear readers,

Just a quick chart update, this time for the COMEX Gold active contract (GCM7). COMEX is where the big guys like to hang out.

Platinum ETF might be issued in Switzerland

Daily chart - COMEX June Gold 100 OZ Contract (GCM7)
Comex Gold Chart

Monday, April 16, 2007

IMF Gold Sell

Just for the record, someone needs to track these guys.


Japan's Omi Recommends IMF Sell Gold Reserves

Japan's finance minister said Saturday he had proposed to the International Monetary Fund's policy-steering body that the fund sell its gold reserves to cover its falling income.

"Japan has told (the committee): 'Why not sell gold?'" Finance Minister Koji Omi told reporters after attending the International Monetary and Financial Committee's spring meeting in Washington.

Omi's proposal is in line with Japan's long-held stance as well as recommendations made earlier this year by a high-level panel at the IMF. In late January, the panel, chaired by Andrew Crockett, president of JPMorgan Chase & Co. (JPM), urged the fund to sell some of its vast gold reserves and invest the proceeds to raise income.

The fund currently is unable to earn enough revenue to cover its operating costs because of its shrinking loan portfolio. Countries such as Brazil, the Philippines and Uruguay have paid off loans from the fund ahead of schedule, reducing interest payments to the international lender, while fewer nations are seeking the fund's financial support.

Commodities traders have been closely watching the IMF's handling of gold. The fund is the third-largest holder of gold reserves in the world, after the U.S. and German central banks. As of late last year, the IMF said it held 103.4 million ounces of gold.
-source

Gold Charts Collection

Yet another higher high for gold. Up trends on all time frames still intact.


Gold Spot Intraday 4 hour candles

intraday


Gold Afternoon Fix 35 years weekly linear chart

35 years linear


Gold Afternoon Fix 35 years weekly log chart

35 years log


Gold Spot 10 years weekly linear chart


10 years linear


Gold Spot 5 years weekly linear chart, Fibonacci levels.


5 years fib


Gold Spot daily linear chart, Fibonacci levels


daily fib

Sunday, April 15, 2007

Weekend Update

Dear readers,

Running this blog since late 2005 I have tried to cover many different subjects which all relate to gold. From weight and purity, through science and forex, to central banks and derivatives- Many different topics are covered.

However, Gold is a basic economic element and as such is affected and influenced by so many factors. This is why I have constantly linked to other information sources which I believe gold investors and traders will find interesting.

For general Economy and Investment issues I strongly recommend Bill Cara and Mish analysis, excellent blogs that will give you a broad and interesting view of what is going on in the markets.

In times I have been more positive in other times negative or natural. I have been wrong in my prediction more then once. Always take my analysis with a grain of salt; nobody can get it right all the time.

One of the most important issues in trading is time frame. I have posted all kind of gold charts, from one minute charts to long term monthly charts. Sometimes I tend to post intraday analysis which anyone who doesn’t day trade should discount. The point is: Always take my analysis with the context of the time frame related.

Currently I see that gold is higher then Friday high which means that the latest intraday Elliott wave count might be close to completion but it isn't there yet.

Stay tuned.

Friday, April 13, 2007

XAUUSD Intraday

Seems to me that gold is ready for some pullback. My intraday Elliott wave count indicates a completion of intraday wave III. Good support at 667$.

XAUUSD Intraday ( 4 hr candles) Chart , click chart to enlarge.

XAUUSD Intraday

Thursday, April 12, 2007

Gold Oil Ratio

Just a quick update for this very important ratio...

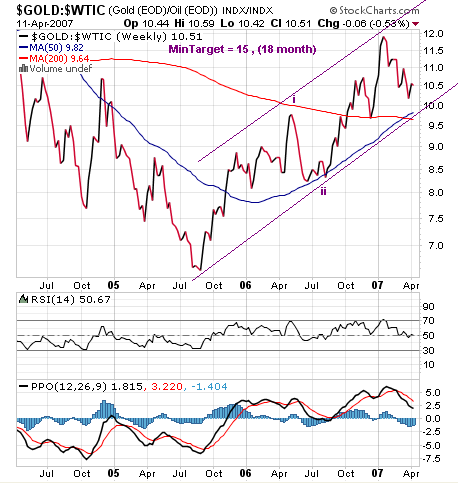
Bullish: note the 50/ 200 MA crossover on the weekly chart, this crossovers doesn’t happen too often. PPO is bearish but above zero, RSI at 50. Short term might drop some but going higher. Minimum target = 15, 18 month time frame.


Gold Oil Ratio chart


Related:


Previous gold / oil ratio charts


Previous crude oil charts

Wednesday, April 11, 2007

Time Frames ...

Dear readers,

The gold price climbed above the previous day high & monthly high to reach ~ 681.5$ for gold spot. Silver rallied to 14$. A new two plus years high for the EURUSD might explain that. Obviously that immediately negated yesterday top indication. However, please note that on an intraday and maybe also daily basis gold and silver can correct to the uptrend support for any reason or none at all.


The Intraday wave count and other technical setups are confusing and currently unfavors short term trades on my side. The Larger time frame still point higher.

Few Interesting blogs are added to the Favorite blogs list at the bottom left side bar so check them out.

Monday, April 09, 2007

Quick Update

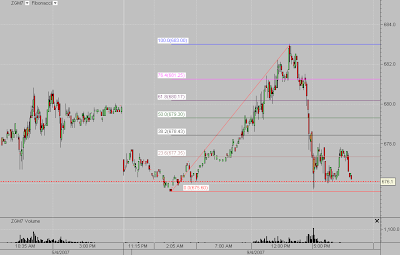
Gold opened with a gap down filled it, made a new high then closed near the day low. The futures volume was low and most of the volume was coming on the down side. From my experience days like this are short term tops candidates (more often then not). Silver was doing better but bumped into short term resistance at spot 13.85$, USD Index trying to rally, Crude Oil down, XAU & HUI unchanged.


CBOT GOLD ZGM7, (enlarge for better view)


CBOT GOLD ZGM7

Friday, April 06, 2007

GLD Elliott Wave Count

The street TRACKS Gold Shares (NYSE: GLD) is the largest Gold ETF in the world, This fund currently holds 494.56 tonnes of gold (15,900,551 oz) which worth about 10,708,379,381 $.

Closely tracking the spot price of gold (less fees) the GLD is up trending since October 2006, while significant pullbacks took place along the way the line connecting the October low and January low remains a buying zone.

From an Elliott wave perspective, the count annotated on the chart implies that any pullback to not lower then ~63$ still maintains the bullish outlook.

Technical Indicators: RSI trending up above 50, PPO bullish crossover, trending up above the zero line.

gld daily chart

Monday, April 02, 2007

Spot Silver

Silver showed greater weakness then gold today, actually I see it as a short term negative for both metals.


Intraday Spot Silver Chart, Fibonacci Levels


intraday spot silver chart


Daily trend remains up as long as silver is above ~12.40$


Daily Spot Silver, Fibonacci Levels

daily spot silver chart

Sunday, April 01, 2007

Fun

Lindsay Campbell WallStrip.com host caught my attention with her beautiful gold pendent. Lindsey is an actress based in NYC. She has a website and a blog.

Is she amazing or what?


source

Search

SUBSCRIBE

Gold Global Perspective Feed

AddThis Social Bookmark Button AddThis Feed Button

Labels