Friday, June 30, 2006

Spot Gold (XAUUSD, XAUEUR) , Charts and Commentary

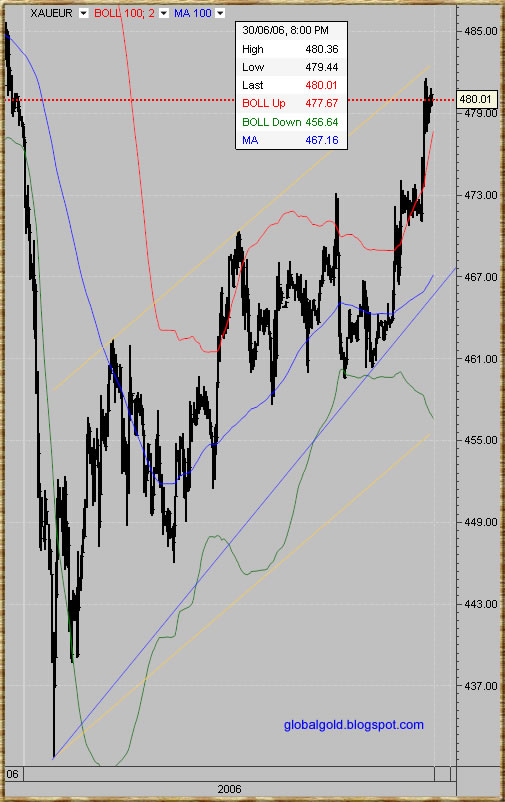
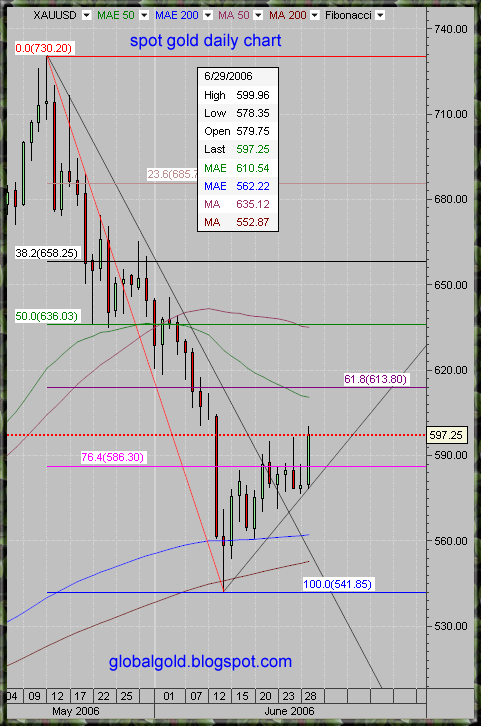
Gold finally show some real strength, closing the week just a bit above the Fibonacci 61.8% level and the exponential 50 daily moving average (50 MAE) on the spot gold chart I posted yesterday. The price action was so strong that even the upper resistance line on the channel chart failed to stop the gold rally.

The Bull market in gold is alive and raging but just like the rodeo it will not be an easy ride.

Next week we might see a pull back to the 76.4% Fibonacci level (~586$), consolidation around the current price or further rally to the 50% Fibonacci level (or higher). This is a wild bull market in gold and If my Elliott Wave analysis is correct this is Wave iii of 3 of III which can be extremely impulsive volatile and extensive.

Related:

Commodities Important news and charts - link

Gold and Silver Stocks reviews - link

Elliott Wave Tutorial (Free for EWI club members) -link

Here are spot gold XAUUSD ; XAUEUR one hour bar charts with 100 MA Bollinger Bands (STD=2).
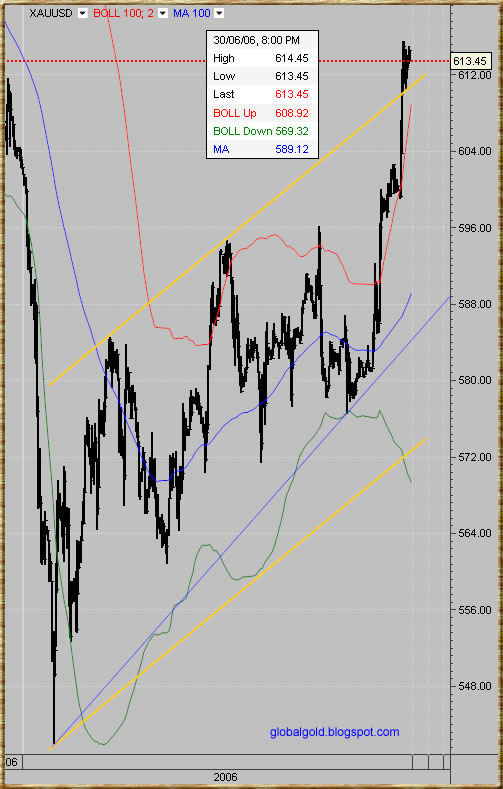
Spot Gold XAUUSD chart

Spot Gold euro chart, XAUEUR

Thursday, June 29, 2006

Gold Chart & Gold Market Commentary

It was a good day for all financial assets including Stocks, Bonds and Commodities, Gold and Silver are up while the USD index is down. HUI the AMEX Gold Bug Index is up 7.79%. Investors and traders lost their fears and bought everything they could, cash piles are back at work as it seems.

I just noticed that the Bank of International settlements (BIS) have published a new paper on over the counter derivatives including gold and other commodities. I will study the report and publish my thoughts and conclusions. You can see my thoughts on the previous BIS OTC report here :
http://globalgold.blogspot.com/2005/12/great-gold-paradox-part-ii.html

Here is a link for June 2006 BIS OTC report

http://www.bis.org/statistics/derstats.htm


In my opinion gold is headed higher to new highs but it will have to struggle with resistance and profit taking along the way. Traders should concentrate on carefully buying bottoms and taking partial profits along the way. Gold is again above the 76.4% Fibonacci line which should provide good support for any impending pullback.

You can contact me regarding any issue - Email

gold chart

Wednesday, June 28, 2006

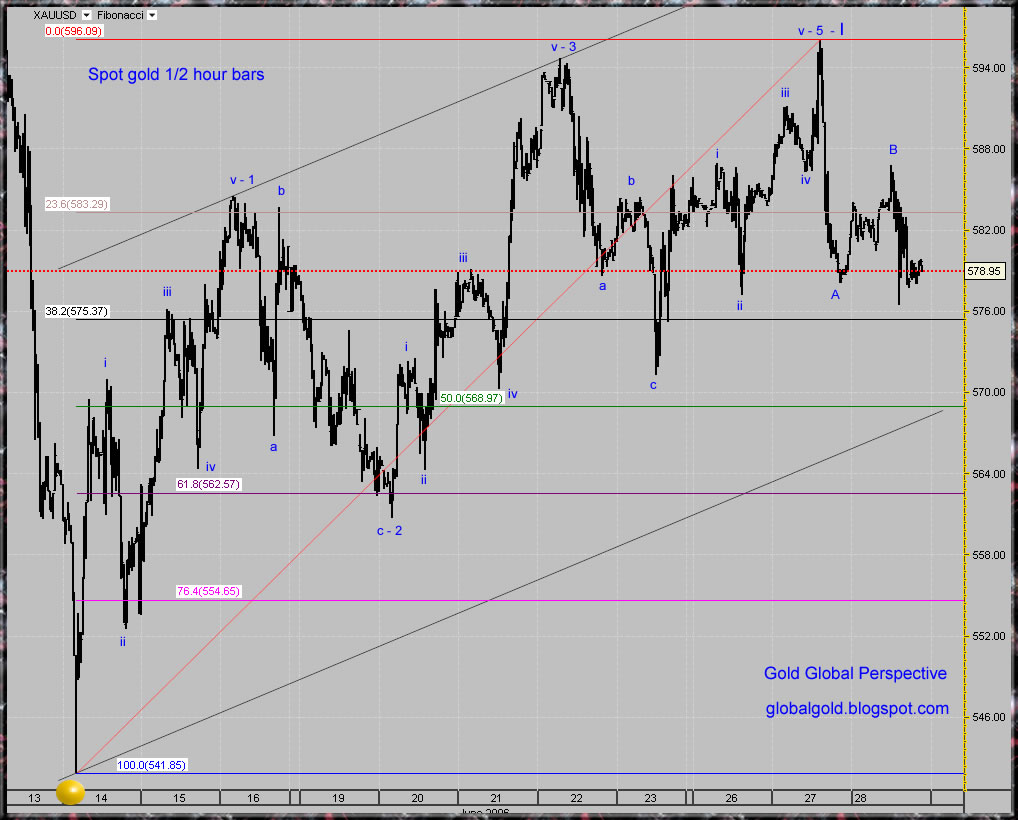
Spot Gold (XAUUSD) Elliott Wave Analysis – Update

Top international banks employees are being paid 5 figures salaries to predict an average gold price of 550$ by mid March 2009.

I say: those are pure lies with the intention to temporary derail this great global gold bull market and allow their employers to accumulate as much physical gold as possible. Later and at much higher gold price they will market it aggressively.

The amount of misinformation regarding gold is as large as the potential price appreciation and that’s quiet a lot!

Investors need not worry and continue to add gold positions on deeps – each one should do its own risk management and liquidity calculation. Short term traders can try to prudently catch gold market bottoms or wait for more bullish confirmation.

Below is spot gold half hour bar chart annotated with Elliott wave count (enlarge chart for better view)

Spot Gold (XAUUSD) Elliott Wave Analysis

Gold , Silver - Spot Intraday Charts

It was an interesting day for the gold market, the price of gold made a marginal new high for the week then pulled it all back, the CBOT contract volume was huge - 35,071 for the 100 oz August contract. This is speculation washout my friends – nothing more, nothing less. Gold will head higher when the time is right.

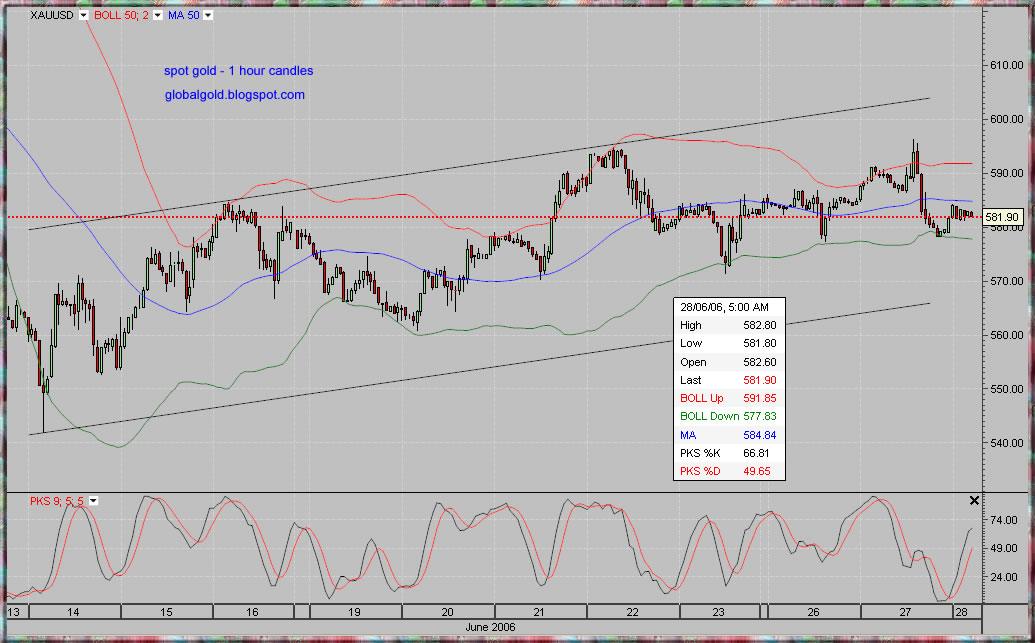
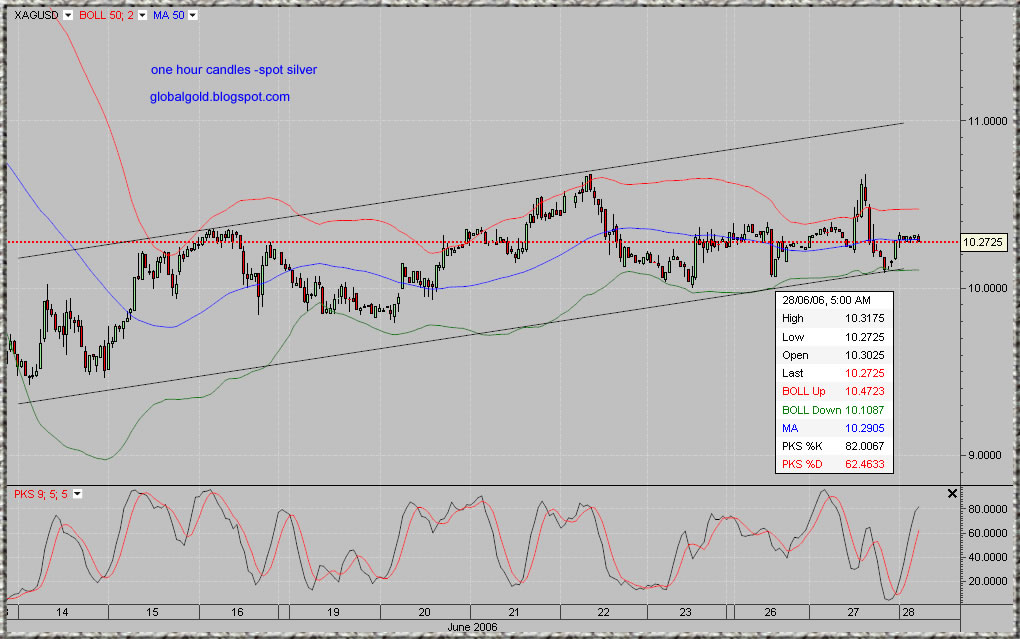
Technically both gold and silver are trading in a modestly raising channel with marginal higher lows and higher highs. This is consolidation pattern.

All fundamental factors are still in place, gold might surprise any moment with spectacular rally. Investors should not fear, there are 101 reasons to buy gold in a conservative way. Traders should be very prudent as timing the gold market is extremely difficult.

Here are gold and silver one hour channel charts with Bollinger bands and stochastic indicator. Click on the charts to enlarge:


Gold spot intraday chart


Silver spot intraday chart

Monday, June 26, 2006

Gold Spot Charts & Commentary


Gold encountered early selling pressure but somehow managed to overcome.

Some positive technical developments:

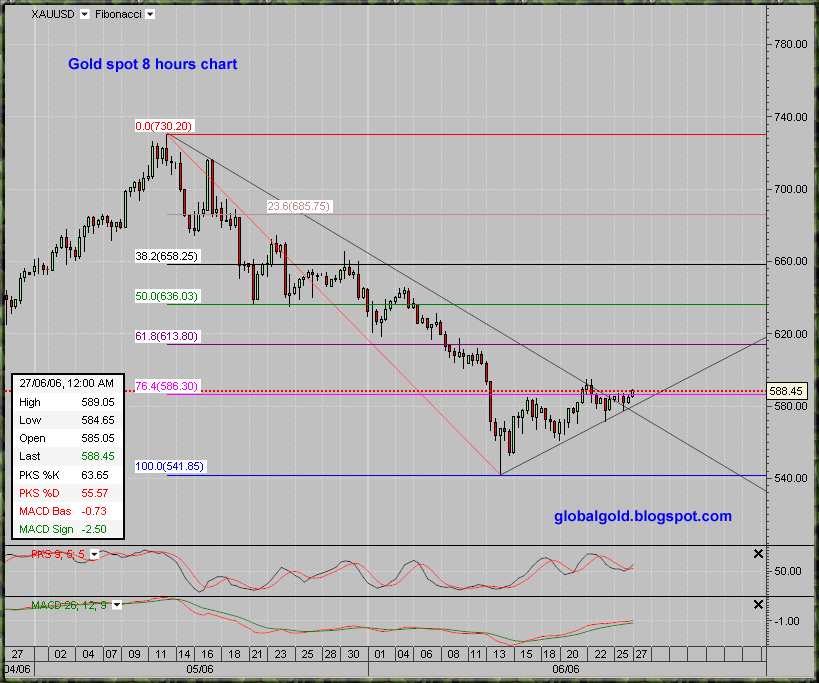
  • The price of gold managed to cross the diagonal downtrend resistance line coming from the 730$ top.
  • Gold is now again above the 76.4% Fibonacci line on the 8 hours chart.
  • The price of gold have constructed potential head & shoulder pattern on the 1/2 hour chart , the initial price target for the pattern is ~603$ per gold ounce.

    Few hurdles are standing on the way but the bottom should be realized by market participants.

    Enlarge charts for better view:

XAUUSD, gold spot 8 hours intraday chart

XAUUSD, gold spot 1/2 hour intraday chart