


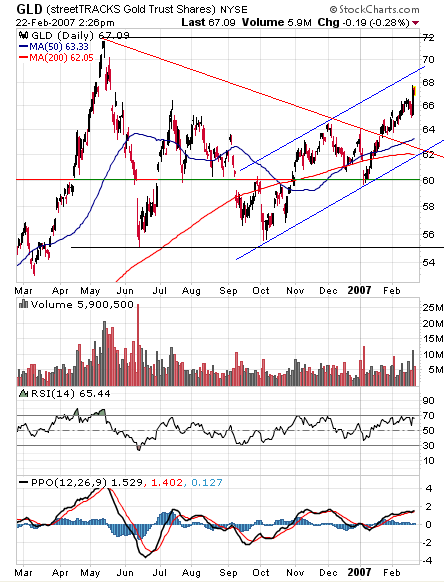
The GLD chart is annotated with the uptrend channel inside a one year trading range of about 17$ which equals to 170$ in the dollar price per gold ounce. The chart includes the ETF volume bars and two indicators, RSI and PPO which both in the overbought territory after up trending since June 2006.

No comments:
Post a Comment