Some of the latest gold market news from around the world:Singapore gold fund trading starts next weekSINGAPORE, Oct 5 (Reuters) - StreetTRACKS Gold Shares (GLD.N: Quote, Profile, Research), the world's largest gold exchange-traded fund, would be cross-listed in Singapore next week in a move to capitalise on Asia's growing fondness for bullion.
It will be listed on Oct. 11 on the Singapore Exchange and would be Asia's first gold-based ETF.
StreetTRACK is the World Gold Council's New York Stock Exchange-listed product, with an average daily volume of around $400 million and assets in excess of $7 billion.
-sourceOfficial Statistics Confound Rumour of Heavy Central Bank Sales: CBGA Sales in Year 2 Confirmed as Well Under Quota at 393 Tonnes
As forecast in mid-September’s Gold Survey Update 1, sales by the signatories to the Central Bank Gold Agreement (CBGA) ended up far short of their annual 500 tonne quota at just 393 tonnes. This confounds market speculation during much of September that there had been a last minute rush to sell gold before the end of the second Agreement year (on 26th September) and that this was responsible for the period’s price weakness.
-source
Riksbank reallocates gold and foreign currency reservesThe Riksbank intends to sell up to 10 tonnes of the gold reserve during the period 27 September 2006 to 26 September 2007. The sale is in compliance with the Central Bank Gold Agreement (CBGA) which was signed by 15 European central banks and came into force on 27 September 2004. The agreement, which runs for five years, enables the Riksbank to sell up to 60 tonnes of gold during this period. To date the Riksbank has sold a total of 25 tonnes of gold, 15 tonnes during the first year of the agreement and 10 tonnes during the second year. The Riksbank’s gold reserve currently amounts to 160 tonnes of gold.
-source
CBOT 100 oz Gold Futures Surpass 60% Market ShareCBOT Full-sized Gold Futures Contract Surpass 60 percent Market Share for the First Time in a Single Trading Day
CBOT Full-sized Silver Futures achieves 10,000 contracts in open interest
CHICAGO October 4, 2006 The Chicago Board of Trade (CBOT) announced today that its Full-sized (100 oz.) Gold futures contract surpassed a market share milestone of
60 percent on October 2, capturing 64 percent of all listed Gold futures traded in North America that day. Open interest in the CBOT Full-sized (5,000 oz.) Silver futures grew beyond 10,000 contracts and set a new record of 10,064 contracts yesterday. The previous record was 9,959 contracts set on September 29, 2006.
Average daily volume in the CBOT Gold complex, consisting of Full-sized (100 oz.) Gold futures and options and mini-sized (33 oz.) Gold futures contracts, reached
52,464 contracts during September and achieved a market share of 54 percent of all Gold futures traded in North America for the month.
-source
iShares SilverBARCLAYS Global Investors has applied to register 15.2 million new shares in its iShares Silver Trust on AMEX doubling the total amount that could be invested, Reuters reported.
"We are registering additional shares. That does not mean the trust is automatically going to buy additional metal," Barclays spokeswoman Christine Hudacko told Reuters.
-source
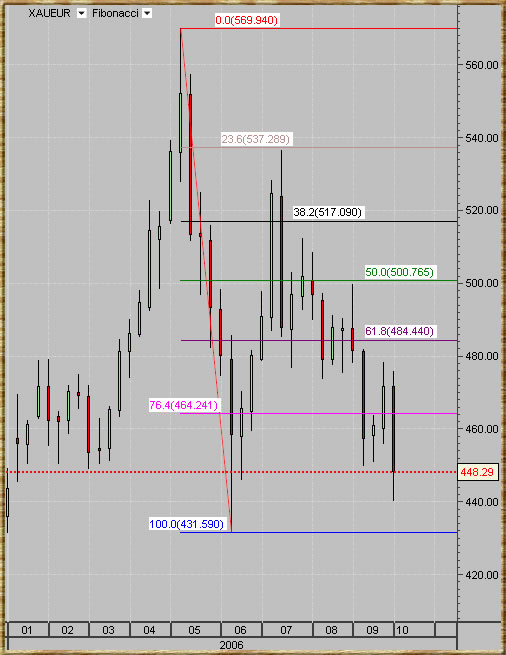
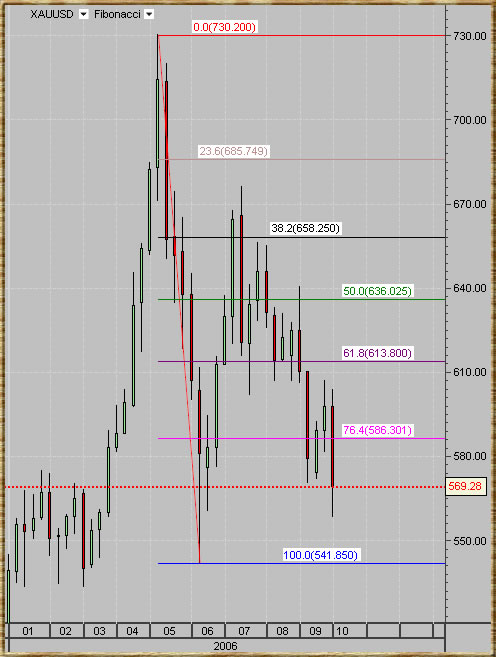
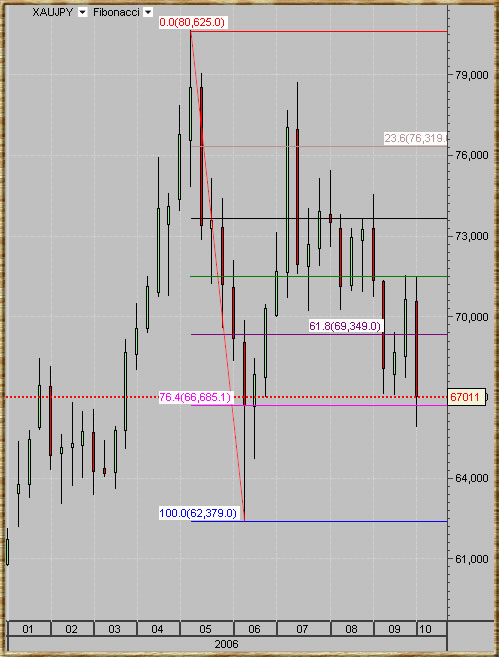
Year to date weekly charts of gold in terms of USD, Euro & Yen.