Sunday, July 27, 2008

Gold Spot Update

Cyclical resistance zones: July 15 high of ~988$ and March 17 high (all times high) ~1032.20$.

Cyclical support zones: 12 Jun Low of ~857.45$ May 2 low of ~845.50$.

Pivot zone : ~912$

Gold spot 8 hours chart (OHLC)

Gold spot 8 hours chart

Sunday, July 20, 2008

Long term currencies charts

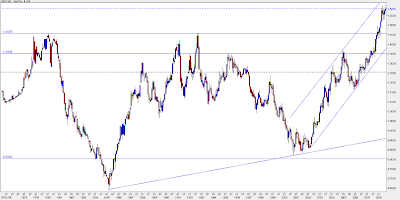
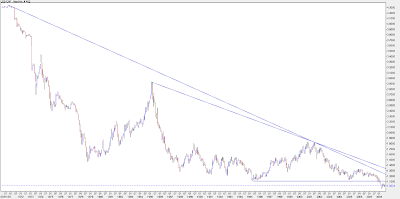
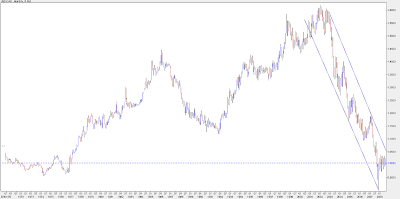
Long term currency perspective , monthly charts:


Euro / US Dollar, EUR/USD 32 years chart – partly synthetic


EUR/USD

Japanese Yen, USD/JPY 33 years chart


USD/JPY

British Pound, GBP/USD 38 years chart


GBP/USD


Swiss Franc, USD/CHF 38 years chart


USD/CHF

Canadian $, USD/CAD 38 years chart


USD/CAD

Australian $, AUD/USD 18 years chart
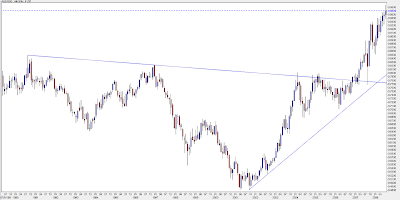

AUD/USD

Gold 37 years chart

Gold

Monday, July 14, 2008

GCQ8 Chart Update

August gold reached 969$.

Support at cyclical lows: 850$ and 860$ are important lows. 875$ and 913$ less important.

No specific resistance point other then the 1041$ high of March, 1000$ and the zone between 969$ to 1002$. If gold can break above the March high (1041$) it can easily move to 1158$ - first target.

GCQ8 Fibonacci Chart – 480 minutes


gcq8 chart

Sunday, July 06, 2008

Gold Chart Update (GCQ8)

Gold continued higher and August Gold (GCQ8) traded between ~920$ and ~949$ .

Higher lows should probably follow : 850$, 860$, 875$ , ? ...

Resistance at : ~950$ , 960$ - 965$ and then 1041$.

Note the Fibonacci levels and diagonals.

August gold 8 hours chart

gold intraday chart (gcq8)

Search

SUBSCRIBE

Gold Global Perspective Feed

AddThis Social Bookmark Button AddThis Feed Button

Labels