Sunday, May 18, 2008

Gold price short term update

Dear readers,

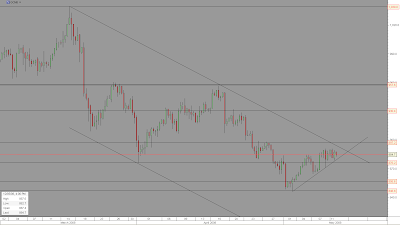
Gold have managed to break and close above the diagonal trend line resistance. Gold is currently trying to rally higher , there is significant resistance zones all the way up to the top at 1038$ (GCM8) , so new highs are not likely any time soon. What is likely is a prolonged consolidation period similar to the price action that took place between mid 2006 and mid 2007.

The price of gold might have to base around till the 65 weekly moving average will be near.

Short term resistance and support zones as well as Fibonacci levels are outlined on the 8 hours gold futures candle chart below .

gold futures intraday chart


The longer term linear weekly bar chart annotated with the 65 moving average ( spot gold 65 MA)


gold weekly chart


The relevant post Nixon gold "Fix" monthly chart (1971 - 2008)
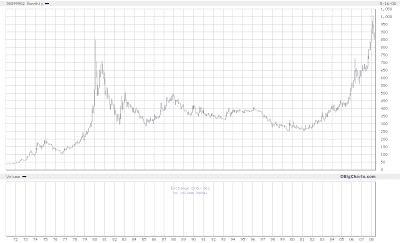

gold price monthly chart

Monday, May 12, 2008

Gold short term technical update

From mid March to early may the price of the Comex June gold contract (GCM8) pulled back about 190$ (1038$ > 846$) currently trading around 885$ . Along gold recent weakness there is some USD strength vs some of the other popular currencies such as the Euro , Yen , British pound, Swiss frank and others.

The trend is still down ( as defined by the diagonal line connecting the major top (1038$ at mid March) with the secondary top (~956$ at mid April), But there is a minor uptrend inside that bigger down trend channel which give some chance for the 846$ bottom to hold.

Support levels : diagonal minor trend line , ~876$, ~856$, ~846$, ~817$, ~792$

Resistance levels : diagonal downtrend line, ~897$, ~913$, ~930.5$, ~957.5$, ~977$, ~1039$.

June Comex gold futures (GCM8) 8 hours chart

gold comex chart

Search

SUBSCRIBE

Gold Global Perspective Feed

AddThis Social Bookmark Button AddThis Feed Button

Labels