Sunday, June 29, 2008
Gold Price Analysis
22 – 27 June 2008 August Gold (COMEX GCQ8 , CBOT ZGQ8 & YGQ8)
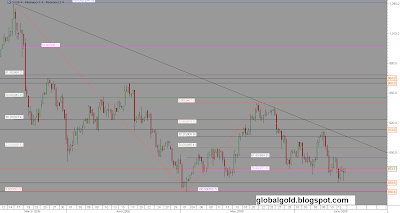
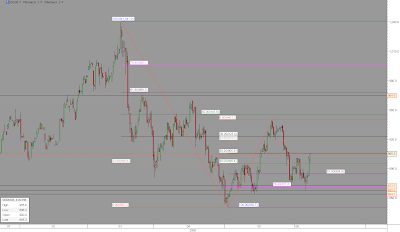
August gold future contracts ranged 56$ (~877$ - ~933$). Gold begun the week on the weak side (price did not make a lower low vs. previous week) but finished rather strong.
Support zones for GCQ8 : 875$ , 860$, 850$ and lower.
Resistance zones for GCQ8: 940$, 960$ - 964$ and 1041$.
August gold futures (GCQ8) 8 hours chart
Note: Gold / Crude oil ratio at historic lows
Sunday, June 22, 2008
Gold market summery for 15 – 21 June 2008
It was an inside week – this week the GCQ8 contract traded (~868$ - 912$) within last week range (~ 859$ - 913$) . gold is trading comfortably in recent range with a slight positive bias as the weekly closing price was higher then last week and also the contract closed at the higher part of the trading range.
Equity market are quickly approaching 2008 lows and $indu:gold ratio is probably ready for new lows.
GCQ8 (August Gold) 480 minutes chart
Dow Jones / Gold ratio linear chart
Equity market are quickly approaching 2008 lows and $indu:gold ratio is probably ready for new lows.
GCQ8 (August Gold) 480 minutes chart
Dow Jones / Gold ratio linear chart
Sunday, June 15, 2008
Gold technical update
Dear readers,
This week the August gold contracts (GCQ8, ZGQ8, YGQ8) traded between ~913$ and ~859$ (54$ range). The price did go below 868$ - 864$ but closed the week at ~873$.
For August gold the important low is ~850$ and if that cant hold then there is major support between 835$ and 770$ ( spot gold price). Spot gold 65 weekly moving average currently around 786$.
Resistance zones for GCQ8 : ~895$, ~913$, ~940$, ( 964$ - 968$ ) and 1040$.
GCQ8 480 minutes chart annotated with short term relevant Fibonacci levels.
Spot gold linear weekly chart with Fibonacci levels.
Sunday, June 08, 2008
August Gold (GCQ8) & Spot Silver (XAGUSD) update
Dear readers,
This last week we have probably seen a successful retest of the low of 864$ and currently gold is trying to move higher towards resistance zone at ~940$.
Support zones for the GCQ8 contract : ~868$, ~864$, ~850$ and Fibonacci levels.
Resistance zones for GCQ8 : ~940$, ~960$, ~964$, ~1040$ and Fibonacci levels.
GCQ8 August gold contract - 8 hours linear Fibonacci chart
Silver has been consolidating and have first support at the 15.96$ – 16.40$ zone and resistance at the 18.33$ – 18.72$ zone. (spot silver prices)
XAG/USD - silver spot daily chart
Sunday, June 01, 2008
August Gold (GCQ8)
Currently the Comex August 100 oz gold future is the most active contract (GCQ8) , open interest for this contract is 257,894 according to NYMEX website.
GCQ7 topped at 03/17/2008 @ 1039.8$ and recently bottomed at 05/02/2008 @850.5$. The trading range this year was ~190$ so far.
Since the 05/02/2008 bottom gold managed to climb ~90$ but then pulled back and lost most of the gain.
Support zones for the GCQ8 contract : ~871$, ~864$, ~850$.
Resistance zones for GCQ8 : ~940$, ~960$, ~964$, ~1040$.
Once this ~190$ trading range is violated refer to the logarithmic weekly gold spot chart below for potential targets and support resistance zones.
GCQ8 August gold contract - 8 hours linear Fibonacci chart
XAU/USD - gold spot weekly log Fibonacci chart
Subscribe to:
Posts (Atom)