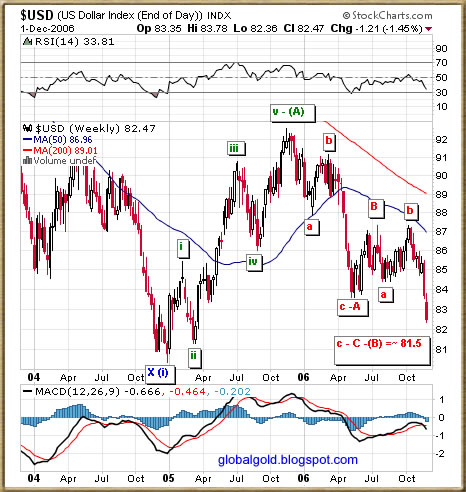
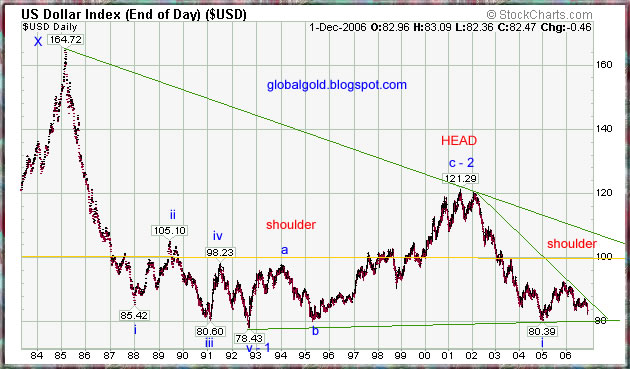
The US Dollar Index (USDX) is approaching its Head and Shoulders pattern target (~81.5). The Elliot Waves count on the 3 years weekly chart indicates that once {c – C –(B)} bottom is in place a sustained 5 waves upward move ( Wave C) should start and it will probably last at least one year. Looking at the 20 years chart it is easy to see that the USD index can go a bit higher then 100 and still stay well inside the bear market long term trend. On the bearish side - note the potential gigantic 13 years head and shoulders pattern, the neckline is around 80 and the price target = ~40.
If you are unfamiliar with Elliott Waves, I strongly recommend that you read this short yet excellent EW tutorial.
Thanks for the charts
ReplyDeleteThat long term chart definitely paints an interesting picture on the long term prospects for the US dollar. If the low at 80.39 is broken decisively and forcefully, then I think it will be safe to label the second shoulder as being the end of wave ii.
ReplyDelete