Wednesday, February 28, 2007

XAUUSD Update

Dear readers,


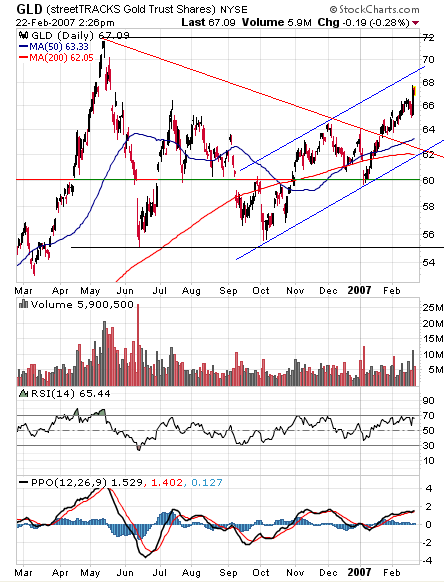
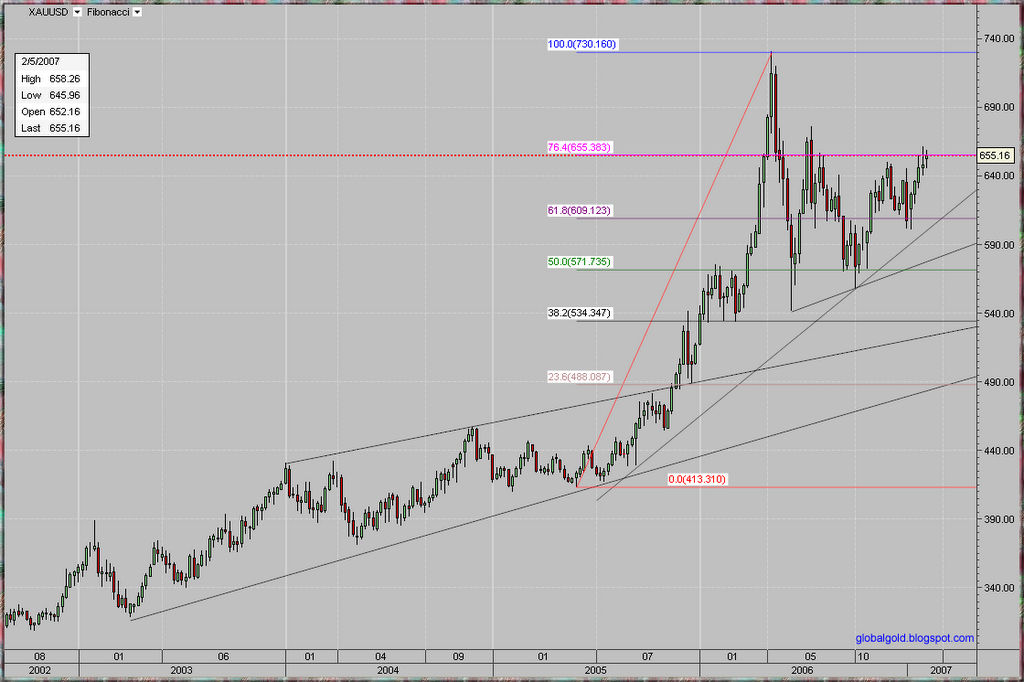
Lets go straight to the point, given the extreme volatility, gold defined a trading range of 33$, 655$ - 688$ for the spot price. In my opinion gold can stay inside this trading range for some time as new positions are building up. A break below the trading range will send the price of gold towards 600$ while a break above and the 2006 high (730$) comes to play. Which way will it go? Well, can go both ways and ultimately depends on where the stop limit orders will be positioned. Continue to be cautious, Play the game or be played!


XAUUSD intraday chart

Sunday, February 25, 2007

Gold Market Commentary

Dear Readers,

Despite of recent spike in the price of gold and silver, gold indices continue to under perform, see recent Gold Indices Review.

I wish to share with you an advertisement I saw at yahoo finance HUI page:

gold speculation 2007


This more then all is a symbol for the current market sentiment, everyone seems to be bullish about gold lately, gold being a popular topic for main stream investing blogs, The extreme bullish sentiment implies extreme caution, I do not recommend initiating any new gold or silver positions at this time. Ride your existing positions and take profit according to your trading style and time frame.

Mitsui Global Precious Metals, Haliburton Mineral Services and Virtual Metals Research & Consulting published the global gold hedge book report. Q4 2006 Hedge Impact declines 1.5 million ounces to 40.2 million ounces. Total dehedging for 2006 was 13.4 million ounces. See the full report here

Thursday, February 22, 2007

GLD Chart

Dear readers,

The GLD chart is annotated with the uptrend channel inside a one year trading range of about 17$ which equals to 170$ in the dollar price per gold ounce. The chart includes the ETF volume bars and two indicators, RSI and PPO which both in the overbought territory after up trending since June 2006.


GLD chart

Wednesday, February 21, 2007

Tricky Gold Market Part II

Dear readers,

Today gold had a big up day after yesterday big down day. Interesting to note that the April Future contract (ZGJ7) high of the day was 703.2$!! . At the same time April Contract at the COMEX (GCJ7) traded not higher then 686.5$. Apparently all buy stop orders at the CBOT where triggered creating a spike up and arbitrage opportunity. This is something that already happened before … Tricks(y) Gold Market

It is amazing that with all the trading algorithms out there no one have come with algorithm to deal with CBOT – COMEX arbitrage. Volunteers?

CBOT Gold Book


CBOT Gold April Chart

Monday, February 19, 2007

Dollar Index (USDX) Elliott Wave Update

As it seems the USD index is at or near a bottom. If my Elliott Wave count is correct then wave 2 is completed and wave three up is expected to begin and carry the USD index higher then the top of wave one(85.45). for longer term USD index charts and Elliott wave count see Saturday, December 02, 2006 US Dollar Index (USDX) Elliott Wave Update

usd index chart

Friday, February 16, 2007

Gold Market Commentary

Dear readers,

In order to understand the current price behavior of gold you have to go back to the early 1980. Back then gold topped at 850$ an ounce, this is also the all time nominal top as most of you probably know. After going extremely parabolic and rising more then 100% in less then 2 month the price of gold immediately crashed back to 500$ in less then two month. Few month later a secondary top was created with a base at 600$ and several peaks above 655. – This is long term support & resistance.


Gold Fix Price 1980

gold fix price 1980 chart


Back to the present; consider the significant pullback in the price of: Crude Oil, Copper among other base metals and broad commodity indices. Gold stocks indices and also Silver did not confirm the recent highs. All this factors and more…support a pullback sooner rather then later. Refer to previous posts for short term Fibonacci support levels which seems to be abundant between 648$ and 600$. From an Elliott Wave perspective a pullback to not lower then 600$ is normal and my wave count stays unchanged.

Monday, February 12, 2007

Spot Gold Commentary

Dear readers,

Gold in terms of yen have made a new multi years high (See the long term gold/yen chart below).

Other then this I would like to repeat several points:

As the great global gold bull market continues expect the price of gold to be more effecting for other market prices and less effected by them. Expect more gold products. Most importantly – Volatility will rise from time to time both on the upside and the downside.

That’s all for now, as time permits I will make my best to keep this gold blog up to date. If you are interested in gold and the factors that determine its price I advice that you search this blog archive which goes back to late 2005 and Includes many links for other free online resources.

spot gold yen long term chart

Friday, February 09, 2007

GLD to Start Earlier Trading

BOSTON--(BUSINESS WIRE)--State Street Global Markets LLC, an affiliate of State Street Global Advisors (“State Street”) (NYSE: STT), and World Gold Trust Services, LLC, a wholly-owned subsidiary of the World Gold Council, today announced that the opening of trading in streetTRACKS® Gold Shares (NYSE Symbol: GLD) on the New York Stock Exchange will be changed from 9:30 a.m. Eastern Time to 8:20 a.m. Eastern Time, effective Friday, February 9, 2007.

The earlier opening will allow investors to start trading streetTRACKS Gold Shares (GLD Shares) at the same time that trading in COMEX® gold futures and gold options commences at the New York Mercantile Exchange Inc.

See also : HUI and GDX charts update

Wednesday, February 07, 2007

Gold, Silver, Crude & Dow

Dear readers,

I'm posting gold and silver spot weekly charts along several gold ratio charts (Dow Jones, crude oil and silver). Please refer to the latest WTI crude oil charts review and this old post:

http://globalgold.blogspot.com/2006/10/dowgold-goldoil-ratios-update.html


spot gold weekly chart

spot silver weekly chart


Dow Jones gold ratio chart

gold WTI crude oil ratio chart

gold silver ratio chart

Saturday, February 03, 2007

Spot Gold Chart

Dear readers,

The price of gold bottomed at early January and managed to climb about 60$ (roughly 10%) . I'm posting a gold spot chart with several Fibonacci sets, diagonal support lines and the continuation of the Elliott wave count.

Enlarge the chart for better view.

spot gold chart

Gold Market News Summery

Dear readers,

It was a busy month! , Posted below are some of the latest international gold market news:

IMF to make central bank gold lending data more transparent

Blanchard & Company study
calling for greater transparency in central bank gold lending accounting has apparently helped to convince the International Monetary Fund to adopt a landmark accounting change in the way central banks account for gold loans.

http://www.mineweb.net/american_notes/596209.htm


IMF advised to sell 400 tonnes of gold


http://www.imf.org/external/np/tr/2007/tr070131.htm

http://www.thepeninsulaqatar.com/Display_news.asp?section=Business_News&subsection=market+news&month=February2007&file=Business_News2007020293025.xml

Britains Chancellor of the Exchequer (Finance Secretary) Gordon Brown was accused in the House of Commons Thursday of losing the equivalent of over 4.5 billion dollars by selling gold assets when prices were low.


http://www.kuna.net.kw/home/Story.aspx?Language=en&DSNO=945883

Euro bank breaks rank, buys gold?

http://www.smh.com.au/news/business/euro-bank-breaks-rank-buys-gold/2007/01/03/1167777153474.html


New gold products…

World Gold Council may offer new funds in Europe and India

http://www.bbj.hu/main/news_21208_world%2Bgold%2Bcouncil%2Bmay%2Boffer%2Bnew%2Bfunds%2Bin%2Beurope%2Band%2Bindia.html

Amfi expects launch of gold ETFs in Feb

http://economictimes.indiatimes.com/Markets/Commodities/Amfi_expects_launch_of_gold_ETFs_in_Feb/articleshow/1144457.cms


NCDEX to launch 10 gm gold contract


http://economictimes.indiatimes.com/Markets/Commodities/NCDEX_to_launch_10_gm_gold_contract/articleshow/1011695.cms

Search

SUBSCRIBE

Gold Global Perspective Feed

AddThis Social Bookmark Button AddThis Feed Button

Labels