Friday, September 29, 2006

Silver – daily and weekly charts

Silver - Poor man gold as some calls it. Silver is one of gold best sentiment indicators. Silver is more volatile then gold, sometimes tend to lead while other times just follow gold. Other then serving as a sentiment indicator for gold, silver is a tradable item by itself.

From a Technical point of view it seems to me that silver (like gold) has just completed an important secondary bottom which is higher then the June bottom. This is good and bullish for both gold and silver. Currently I expect both silver and gold to hold their September bottoms and head higher and retest the diagonal resistance line.

As always, expect and assume the unexpected while trading, at the market place nothing is sure other then fees and commissions.

Silver charts annotated with simple annotations which are self explaining.

Refer to previous posts for more silver charts and Fibonacci levels. As of now no Elliot waves count update.

Silver  daily chart

Silver   weekly chart

Tuesday, September 26, 2006

Gold, Fibonacci Set – Update

If gold will find it way up sooner then later and the 570's USD levels will prove to be an important secondary bottom then the Fibonacci lines on both Spot and Futures gold charts will act as short term support and resistance levels. I'm posting these two charts annotated with diagonal minor uptrend lines.

For GDX, HUI, and XAU – Fibonacci levels, refer to these posts


(You can click on the charts for larger view)

Gold spot intraday fibonacci chart

Gold futures intraday fibonacci chart

Saturday, September 23, 2006

Gold Market News

Central Bank to increase gold metal reserves

RBC, 21.09.2006, Moscow 18:45:08.The Bank of Russia intends to increase the volume of gold metals in Russia's gold and foreign currency reserves, the Bank's First Deputy Chairman Alexei Ulyukayev told the State Duma budget committee today. The share of gold in the country's gold and foreign currency reserves is 3 percent at present. If the volume of gold metals increases, still its share will not raise, he noted.

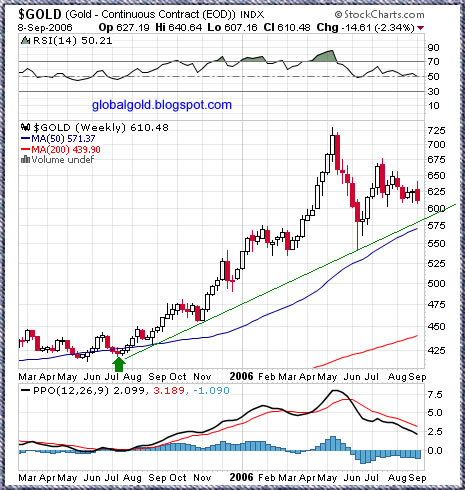
The prices of gold and other precious metals have been rising lately but the market is correcting at present, Ulyukayev stressed. The gold price is now $550 per ounce, which is $80-90 lower than the record price. The metal prices are highly volatile at the moment, but the Central Bank has not imposed any limits on gold acquisition, he said.

Russia's gold reserves exceed 380 tonnes. -source

Agreement on electronic metals trading

By Kevin Morrison

Nymex Holdings is expected to issue $300m of shares to members of its metals futures division Comex, after an agreement on Thursday for Comex gold, silver and copper futures to trade electronically. -source

Finans Portfoy Launches First GOLD ETF in Turkey

Istanbul GOLD ETF, GOLDIST, will be offered to public on September 21st and 22nd.
Finans Portfoy, an Istanbul based asset management company, launches the first GOLD ETF in Turkey. Istanbul GOLD ETF, GOLDIST, will be listed on the Istanbul Stock Exchange and is expected to start trading next week. GOLDIST will be based on international Gold price and denominated in grams. -source


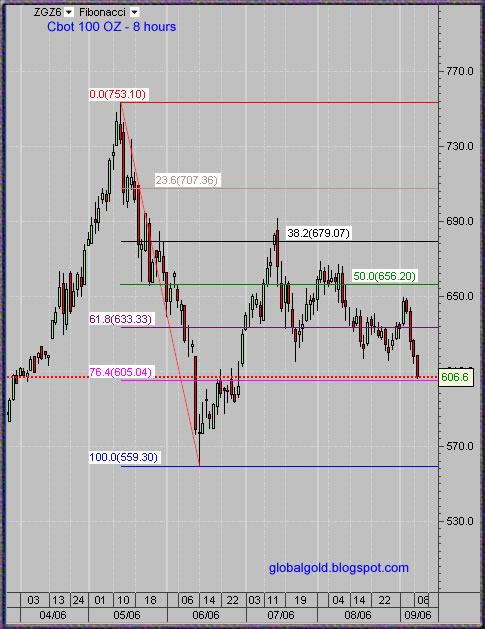
CBOT Expands Availability of Gold & Silver Options to Open Auction Market


CHICAGO, IL (September 20, 2006) – The Chicago Board of Trade (CBOT) announced today that it plans to expand the availability of its options on Full-sized Gold (100 oz.) and Silver (5,000 oz.) futures by listing the contracts on its open auction trading floor, side-by-side with the e-cbot® electronic trading platform, beginning in the fourth quarter of 2006. Currently, the contracts trade exclusively on e-cbot, the Exchange’s electronic trading platform.

Also, effective October 1, 2006, the CBOT is waiving all Exchange transaction fees for Metals options trading for all fee categories. The fee waiver will apply to Metals options trade transactions on both CBOT platforms. The transaction fee waiver will remain in effect until June 30, 2007. -source


American Stock Exchange Lists Central Gold-Trust

NEW YORK, Sept. 22 /PRNewswire/ -- The American Stock Exchange(R) (Amex(R)) announced today that it has begun trading the units of Central Gold-Trust under the ticker symbol "GTU". The Trust began trading on the Toronto Stock Exchange in 2003 under the ticker symbols "GTU.UN" (denominated in Canadian dollars) and "GTU.U" (denominated in US dollars) and is now dually listed on the Amex. -source

Wednesday, September 20, 2006

Gold spot weekly chart

Look at the weekly chart below then look at the intraday chart at the previous post. Can you see the significance of the 570's for spot gold?

Strong resistance at 610's for spot gold but if gold will start climb back up – (I think it will) almost no resistance from 570's to 610's.

That's all for now.


Gold spot weekly chart

Tuesday, September 19, 2006

XAUUSD - Fibonacci levels

Below is intraday spot gold chart with two sets of Fibonacci lines. Click on the chart to enlarge.

intraday spot gold chart

Saturday, September 16, 2006

Gold & Silver Commentary

The gold and silver charts looks ugly BUT the price of gold and silver is just around the 50 weekly moving average and some horizontal support. Fundamentals still in place. I think that the market is saturated with short side speculation. Long term conservative investors and physical buyers should use the opportunity and increase their regular purchases. See previous posts for relevant Fibonacci levels , take a look at CRB, CCI COMMODITY INDEX and Gold Indices - XAU , HUI - Fibonacci update

Sunday, September 10, 2006

Gold and silver weekly charts

Dear readers, few short notes:

1) Seasonality, depressed sentiment and Euro relative weakness have all brought to an extremely short term oversold condition.

2) The silver chart looks better then the gold chart.

3) In my opinion global geopolitics along global economy developments certainly support higher gold price but not necessarily lower USD index.

4) Long term wave (III) trend lines are annotated on weekly charts, Intraday Cbot active contract is near Fibonacci support level.

 silver weekly chart

gold weekly chart

gold intraday chart

Search

SUBSCRIBE

Gold Global Perspective Feed

AddThis Social Bookmark Button AddThis Feed Button

Labels