


Thursday, August 31, 2006
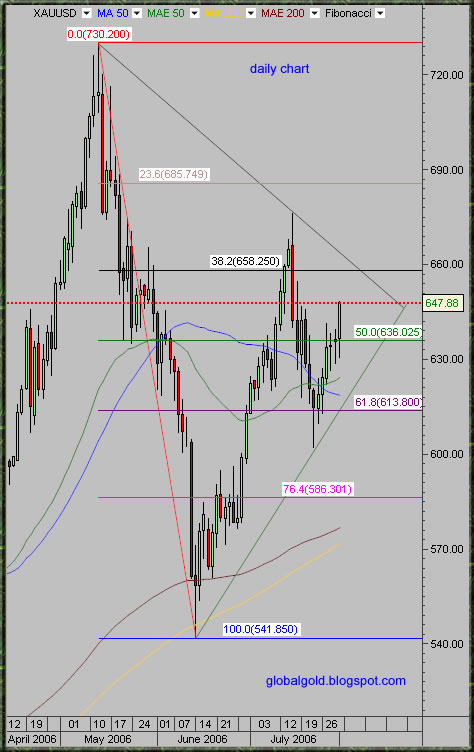
Spot Gold daily chart
Gold broke down from a triangle pattern but the downside has been pretty poor – the bear trap scenario might be in play (browse the archive for more details). Bear side speculators must be disappointed and might soon suffer great loses.
Tuesday, August 29, 2006
Gold (ZGZ6) short term intraday chart
Possible construction of slightly higher gold low. ZGZ6 Contract (CBOT December gold futures) - Fibonacci, intraday chart below (enlarge chart for better view).
Reform on the cards for the IMF
Belgium or India? Which has more clout when it comes to decision making on loans to developing countries and on global economic stability?
Despite India's economy being about twice the size of Belgium's and it having a population of over one billion compared to Belgium's ten million, the European country wields more influence at the International Monetary Fund (IMF).
This is why many think the IMF is ripe for reform - including the IMF itself -source
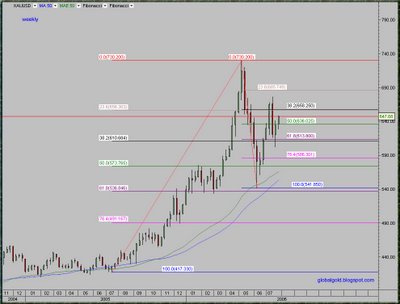
XAU index Fibonacci chart
Reform on the cards for the IMF
Belgium or India? Which has more clout when it comes to decision making on loans to developing countries and on global economic stability?
Despite India's economy being about twice the size of Belgium's and it having a population of over one billion compared to Belgium's ten million, the European country wields more influence at the International Monetary Fund (IMF).
This is why many think the IMF is ripe for reform - including the IMF itself -source
XAU index Fibonacci chart

Tuesday, August 22, 2006
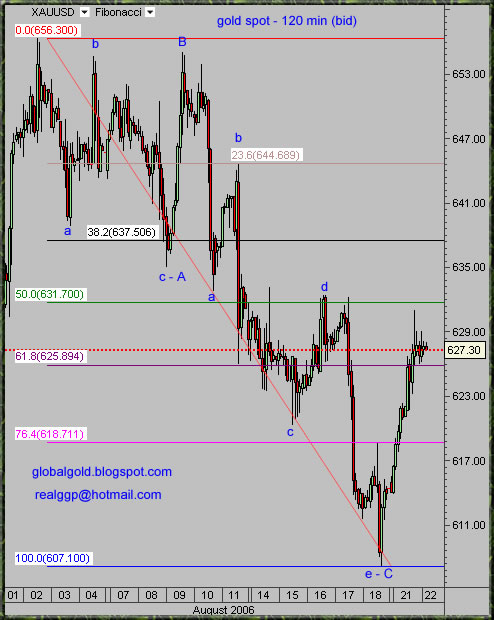
Spot Gold Intraday Chart
Gold found some kind of bottom at 607$ and currently trading about 20$ higher. Below is spot gold bid price 120 minutes candles chart. August was not a good month for gold but there is still some time for repairs. The chart is annotated with new short term Fibonacci numbers and minor Elliott wave count for your convenience.
For the watch list - VGZ , MNG - charts
For the watch list - VGZ , MNG - charts
Monday, August 21, 2006
Gold Market Overview
Gold supply demand analysis papers
Two reports, the first is by the World Gold Council (WGC) and GFMS, published each quarter.
Gold supply demand analysis report I
The second report, the Yellow Book by Virtual metals / Fortis bank, published twice a year.
Gold supply demand analysis report II
The reports are worth reading and basically present the same information. However, each rely on different data and the numbers are not quite the same. In my opinion the data is not so accurate to say the least. It is impossible to track the complete supply demand of gold, some kind of gold transactions are taking place in each and every country and some markets are not very transparent.
Read this reports with a grain of salt , this is as good as it gets but take in to account that all analysts and entities have their own agenda , market sentiment , position and so forth.
Gold miners hedging
The Hedge Book by Mitsui Global Precious Metals, Virtual Metals and Haliburton Mineral Services – This report analyze the hedging practice (forward gold transactions) of the gold miners industry - I assume that this report is relatively accurate when compared with the supply demand reports. This report is tracking the gold mining industry and most of the hedge practice is concentrated with few big miners.
Gold miners hedging report
Gold over the counter derivatives report by the Bank for International Settlements (BIS)
The Semiannual Over-The-Counter (OTC) Derivatives Markets Statistics is comprehensive and provide some information on the size and structure of derivatives markets in the G10 countries and Switzerland. Gold OTC Derivatives are just a small fraction of total OTC derivatives, gold derivatives represents less then 1% of total Over-The-Counter derivatives contracts. Even tough, the numbers related to gold are running at hundreds of billions USD for notional amounts and tens of billions USD for gross market values.
This report is the least mentioned by gold commentators but it is the most important of all in my opinion, the reason? - The sums of money involved in the OTC gold derivatives market dwarfs both total supply demand annual volume and the full impact of gold hedging.
The OTC derivatives report is insightful for the reason it reveals the extremely large size of gold obligations, the numbers are so big that you can be assured that the gold bull market will last many years.
Gold over the counter derivatives report by BIS
CHEUVREUX Gold Report
This report by investment analyst Paul Mylchreest is not less then ground breaking. The report which was published early this year, carry the sub title - "Start Hoarding" and clearly present the bullish case for gold. – Well worth reading.
CHEUVREUX Gold Report
Entities mentioned
The Bank for International Settlements (BIS) is an international organization which fosters international monetary and financial cooperation and serves as a bank for central banks.
The World Gold Council (WGC), a commercially-driven marketing organization, is funded by the world’s leading gold mining companies.
GFMS is a precious metals consultancy, specializing in research of the global gold, silver, platinum and palladium markets.
Virtual Metals is a group of analysts specializing in precious and base metals, energy and soft commodities.
Mitsui Global Precious Metals is part of the Mitsui group and conducts its business in the precious metal market; it is also Japan's largest manager of commodity funds.
Fortis is an international provider of banking and insurance services to personal, business and institutional customers.
Haliburton Mineral Services Inc. is a private mining research and advisory business based in Toronto, Canada.
CHEUVREUX - equity broking and investment firm, subsidiary of Calyon and a member of the Crédit Agricole SA group.
Wednesday, August 16, 2006
Gold and Silver Mining Stocks
Dear readers, I'm deeply sorry for posting less lately.
I decided to trade more and post less.
See the latest HUI technical overview.
I will do my best to keep you up to date with any major gold technical and fundamentals developments.
I decided to trade more and post less.
See the latest HUI technical overview.
I will do my best to keep you up to date with any major gold technical and fundamentals developments.
Monday, August 14, 2006
Intraday Gold Charts
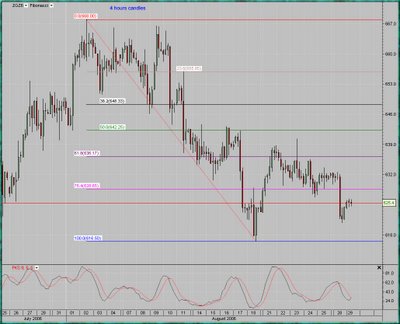
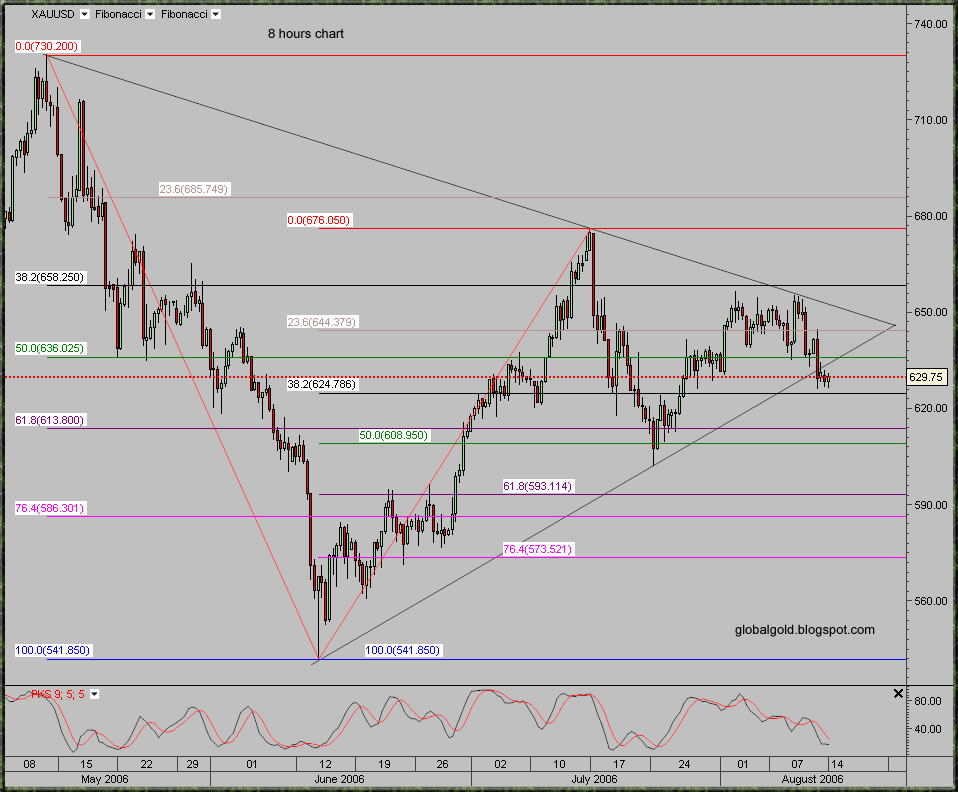
Below are two intraday charts of spot gold, each with two sets of Fibonacci lines and stochastic indicator. Gold broke down from the triangle formation, it's a head fake in my opinion and I did mentioned this possibility here.
Click on the charts below to enlarge
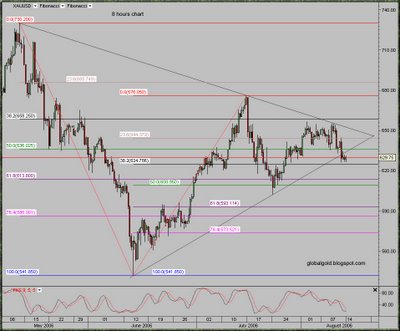
Click on the charts below to enlarge

Saturday, August 12, 2006
Investing the Middle Way: Guide to investing in gold and silver bullion
Some of you will find this information valuable: Investing the Middle Way: Guide to investing in gold and silver bullion
Later...
Later...
Thursday, August 10, 2006
Gold and Silver Technical Update
GOLD TRUST (GLD) BEGINS TRADING ON MEXICO’S BMV-source
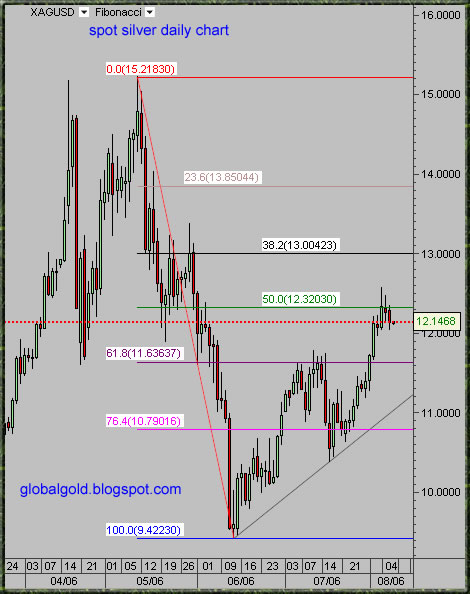
Silver consolidates around the 50% Fibonacci line. Support at 11.63$, trend line support at 11.20$ and raising, resistance at 13$.
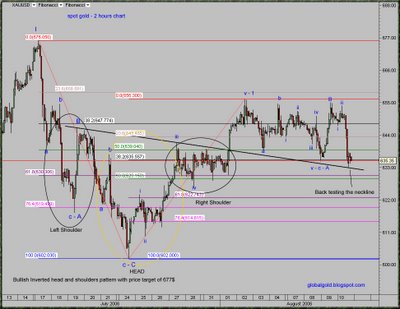
Gold had a technical failure of minor proportion, the (C - 2) low on yesterday chart failed to hold. Yesterday wave count is modified to reflect the technical failure. There is nothing to worry about for investors but highly leveraged traders took a hit. The
Inverted head and shoulders pattern with price target of 677$ that I mentioned here is still in play - I believe, coincidently today low was the pattern neckline. Overall the downside for gold is limited while the upside potential is high.
Click on the chart below for enlarged view:
Silver consolidates around the 50% Fibonacci line. Support at 11.63$, trend line support at 11.20$ and raising, resistance at 13$.
Gold had a technical failure of minor proportion, the (C - 2) low on yesterday chart failed to hold. Yesterday wave count is modified to reflect the technical failure. There is nothing to worry about for investors but highly leveraged traders took a hit. The
Inverted head and shoulders pattern with price target of 677$ that I mentioned here is still in play - I believe, coincidently today low was the pattern neckline. Overall the downside for gold is limited while the upside potential is high.
Click on the chart below for enlarged view:

Fibonacci and Parabolic Moves
Just a quick reminder:
1) The price target for gold remains ~1000$ for 2006.
2) Gold will rally regardless of the minor fluctuations in paper Forex markets.
3) The best way to play gold is gold.
4) The price of gold will be determined by gold market internal factors.

1) The price target for gold remains ~1000$ for 2006.
2) Gold will rally regardless of the minor fluctuations in paper Forex markets.
3) The best way to play gold is gold.
4) The price of gold will be determined by gold market internal factors.
Wednesday, August 09, 2006
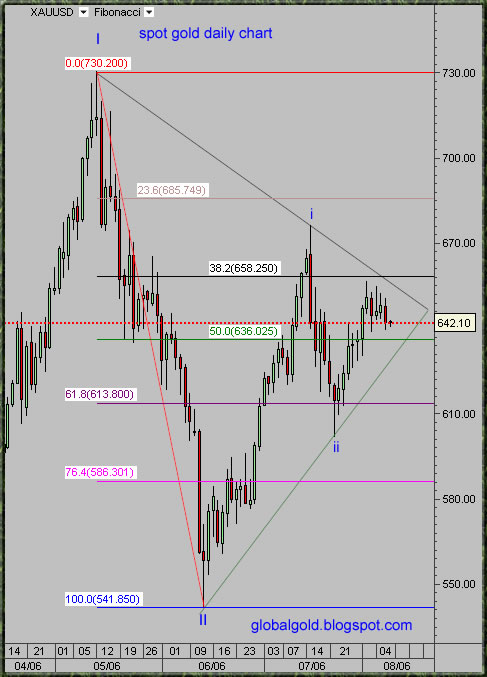
Gold Elliott Wave Count - Update
The count on the chart below is inline with previous counts. This is the minor count for Major Wave (iii - III). Elliott Wave is important technical tool which can help and improve your market timing. If you are new to Elliott Waves – see this Elliott Wave Tutorial by EWI (needs registration).

Tuesday, August 08, 2006
Gold and Silver –Charts & Commentary
The US Federal Reserve decided to leave Interest Rate Unchanged at 5.25 Percent, Its First Pause in 2 Years.
The gold market reacted with modest rally, somewhat abnormally but certainly not surprising - gold immediately sold off and traded at the low for the day.
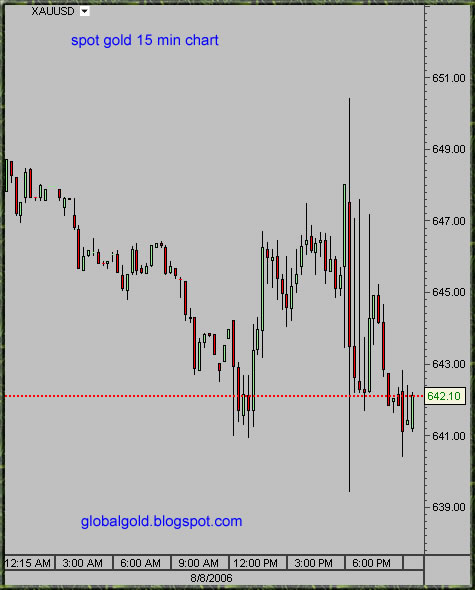
Looking at the daily chart, Same Elliott wave count, this is wave (iii of III), triangle formation which will break to the upside in my opinion and result in a spectacular rally. Notice that gold can go to 630$ and the formation will still stay valid, It is also possible that gold will first break down (head fake). Silver will follow gold and can sometimes lead.
All in all a little bit more consolidation is possible but gold will head higher quite soon. Those of you who do not trade gold on an intraday basis can safely accumulate at current price and average up or down.
During Bull markets, for conservative positions - perfect timing is not as important as consistency and patience . On the other hand – for aggressive long positions and short positions of all kinds – Timing is everything!
Q2 2006 Gold Hedge Book Report
This 30 page report by: Mitsui Global Precious Metals, Haliburton Mineral Services, and Virtual Metals Research & Consulting. – Unique in depth analysis of the gold miners hedge positions. - Link
The gold market reacted with modest rally, somewhat abnormally but certainly not surprising - gold immediately sold off and traded at the low for the day.
Looking at the daily chart, Same Elliott wave count, this is wave (iii of III), triangle formation which will break to the upside in my opinion and result in a spectacular rally. Notice that gold can go to 630$ and the formation will still stay valid, It is also possible that gold will first break down (head fake). Silver will follow gold and can sometimes lead.
All in all a little bit more consolidation is possible but gold will head higher quite soon. Those of you who do not trade gold on an intraday basis can safely accumulate at current price and average up or down.
During Bull markets, for conservative positions - perfect timing is not as important as consistency and patience . On the other hand – for aggressive long positions and short positions of all kinds – Timing is everything!
Q2 2006 Gold Hedge Book Report
This 30 page report by: Mitsui Global Precious Metals, Haliburton Mineral Services, and Virtual Metals Research & Consulting. – Unique in depth analysis of the gold miners hedge positions. - Link
Monday, August 07, 2006
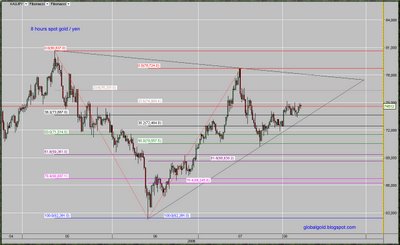
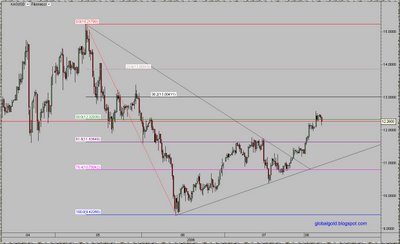
Gold / ($, €, ¥) & Silver – Charts
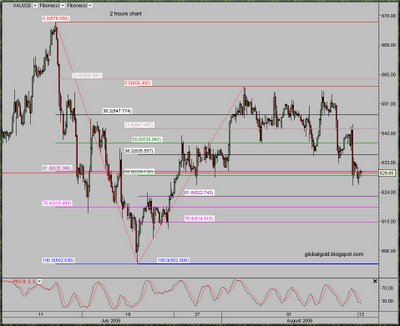
The gold market has been pretty boring the last few trading days. Gold is stuck in a relatively tight trading range (638$ - 656$) – see the first gold chart below.
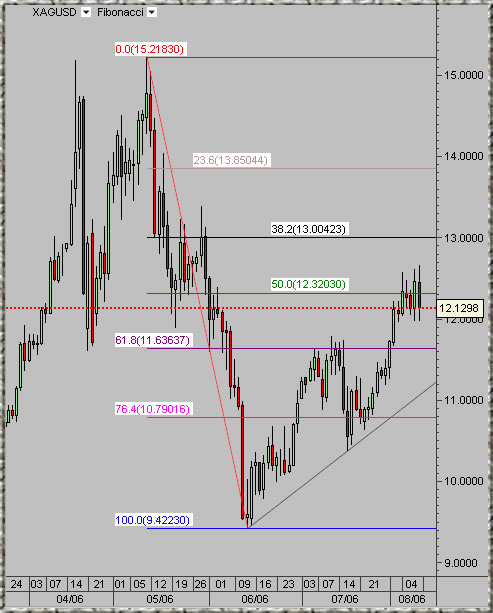
Looking at the 3 month gold charts – gold formed a triangle pattern which is not yet completed. The pattern is similar for Gold/USD, Gold/Euro and Gold/Yen. Silver already broke above its diagonal resistance and consolidates around the 50% Fibonacci line (~12.30$).
It is quiet possible that gold will continue to consolidate around current levels (638$ - 656$) further consolidation is also possible and gold can go as low as 620's (not likely). IF gold can break above the diagonal resistance line, that will ignite a serious rally (I think it can).
As of now, nothing more to report other then:
CBOT (August 4, 2006) system failure - link
China's silver consumption triples
(Xinhua)Updated: 2006-08-07 16:20
China consumed 2,600 tons of silver in 2005, nearly three times the volume of twenty years ago, said sources with the Gemological Association of China.
But the country exports even more than it consumes. With an all-time record production of 7,196 tons of silver in 2005, China has become the world's third biggest silver supplier.
Exports of silver rose to 4000 tons in 2006, up by a third from the 3050 tons notched up in 2004.
Consumption at home surged 190 percent to 2600 tons in 2005 from a modest 900 tons in 1985. Despite the constant fluctuations in the prices of gold and silver on the international market, China's silver consumption has continued to grow steadily in recent years, said the association.-link.
See also:
Gold and Silver Stocks
Commodities Charts
Click on the charts below for enlarged view:
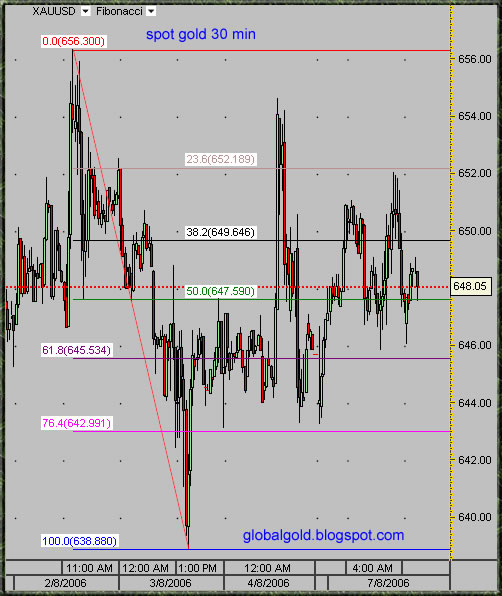
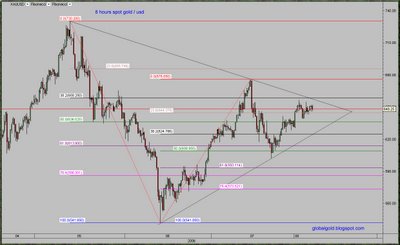
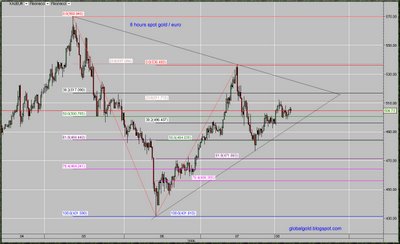


Thursday, August 03, 2006
Thoughts on Gold + Intraday Chart
Might be worth to repost this:
(Originally posted Saturday, January 21, 2006)
Gold is neither holy nor sacred; I do not worship gold or anything else for that matter. The purpose of this site is to share my thoughts, knowledge and charts.
Many analysts tend to explain the movements in the price of gold with political events, I disagree about that. In my opinion the price of gold doesn't have much to do with politics like most analysts tend to think.
What are the drivers behind the price of gold?
The variables which determine the price of gold could be devised into two main groups:
Internal variables:
1) Physical gold supply(limited) and demand.
2) Paper gold (futures, options, OTC derivatives, CFD, ETF, etc.) supply (unlimited) and demand.
3) Crowd
External factors:
1) Monies supply in the form of M1, M2, M3…Mn , for each currency C1, C2, C3…Ck, Subtotal of the summarized matrix {[Mn] X [Ck]}
2) Systematic risks and malfunctions of the global monetary system and the crowd psychology regarding those issues.
3) Inflations deflations debates, expectations and perceptions.
All of those are very complicated issues which are largely misunderstood even by the professional gold analysts. That’s my opinion and this is why technical analysis is so important when you want to understand the gold market.
GDX – Gold Miners ETF – chart analysis.
The Hedge Book Q2 2006 , Hedge Impact declines by 5.1 Moz
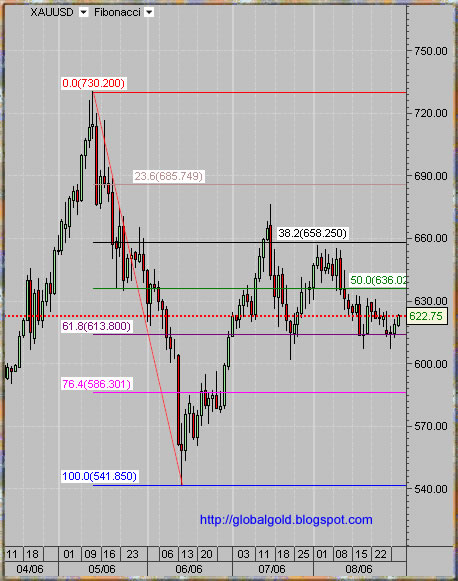
Currently gold is trading between the 38.2% and 61.8% Fibonacci lines. The trend is higher but some consolidation might be expected.
Click on the chart below to enlarge:
(Originally posted Saturday, January 21, 2006)
Gold is neither holy nor sacred; I do not worship gold or anything else for that matter. The purpose of this site is to share my thoughts, knowledge and charts.
Many analysts tend to explain the movements in the price of gold with political events, I disagree about that. In my opinion the price of gold doesn't have much to do with politics like most analysts tend to think.
What are the drivers behind the price of gold?
The variables which determine the price of gold could be devised into two main groups:
Internal variables:
1) Physical gold supply(limited) and demand.
2) Paper gold (futures, options, OTC derivatives, CFD, ETF, etc.) supply (unlimited) and demand.
3) Crowd
External factors:
1) Monies supply in the form of M1, M2, M3…Mn , for each currency C1, C2, C3…Ck, Subtotal of the summarized matrix {[Mn] X [Ck]}
2) Systematic risks and malfunctions of the global monetary system and the crowd psychology regarding those issues.
3) Inflations deflations debates, expectations and perceptions.
All of those are very complicated issues which are largely misunderstood even by the professional gold analysts. That’s my opinion and this is why technical analysis is so important when you want to understand the gold market.
GDX – Gold Miners ETF – chart analysis.
The Hedge Book Q2 2006 , Hedge Impact declines by 5.1 Moz
Currently gold is trading between the 38.2% and 61.8% Fibonacci lines. The trend is higher but some consolidation might be expected.
Click on the chart below to enlarge:
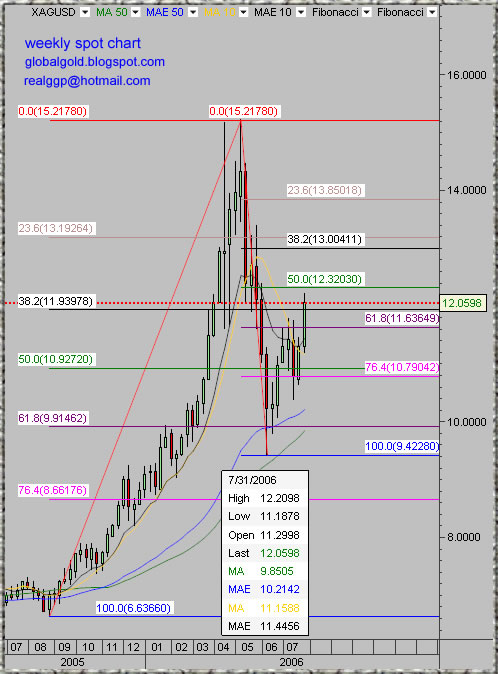
Silver Weekly Chart
Silver is clearly on the lead, already trading above the July top, gold will soon follow.
China should actively manage 20-30 pct of forex reserves - govt economist
BEIJING (XFN-ASIA) - China should set aside 20-30 pct of its foreign exchange reserves to be actively managed, a government economist said.
Xia Bin, head of the financial research institute within the Development Research Center, a think tank under the State Council, also said that China should increase its holdings of gold 'at the appropriate time.'
He said that the overly rapid accumulation of foreign exchange reserves could imperil management of the economy, and that steps should be taken to put excess reserves to work...- source
Below is a weekly spot silver chart with what I think are very important Fibonacci numbers. If you trade gold and silver then pay attention to this numbers.
Tuesday, August 01, 2006
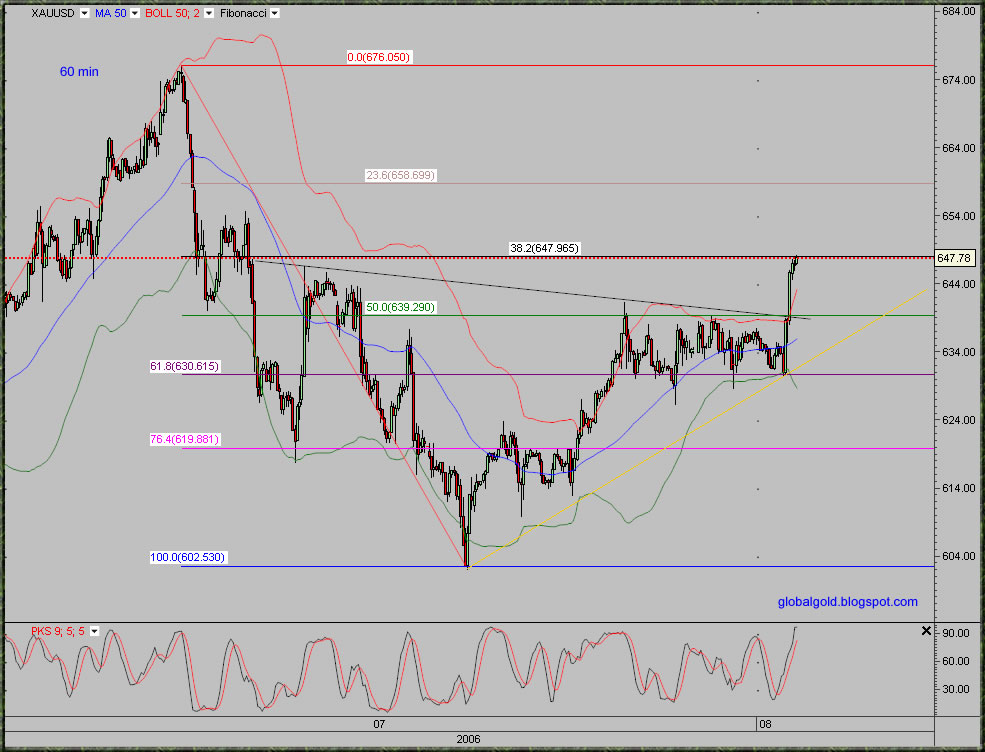
Spot Gold Charts
Good day for gold and silver. Gold moved higher to test resistance at the 38.2% Fibonacci line (see the first chart below), 50% Fibonacci line at 639$ - previous resistance is now first short term support level.
Click on the charts below to enlarge:
Click on the charts below to enlarge:

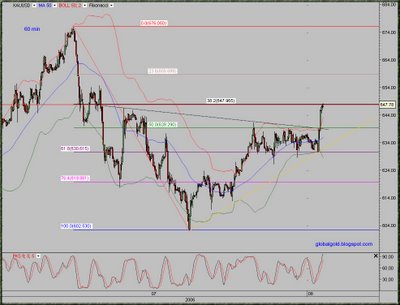
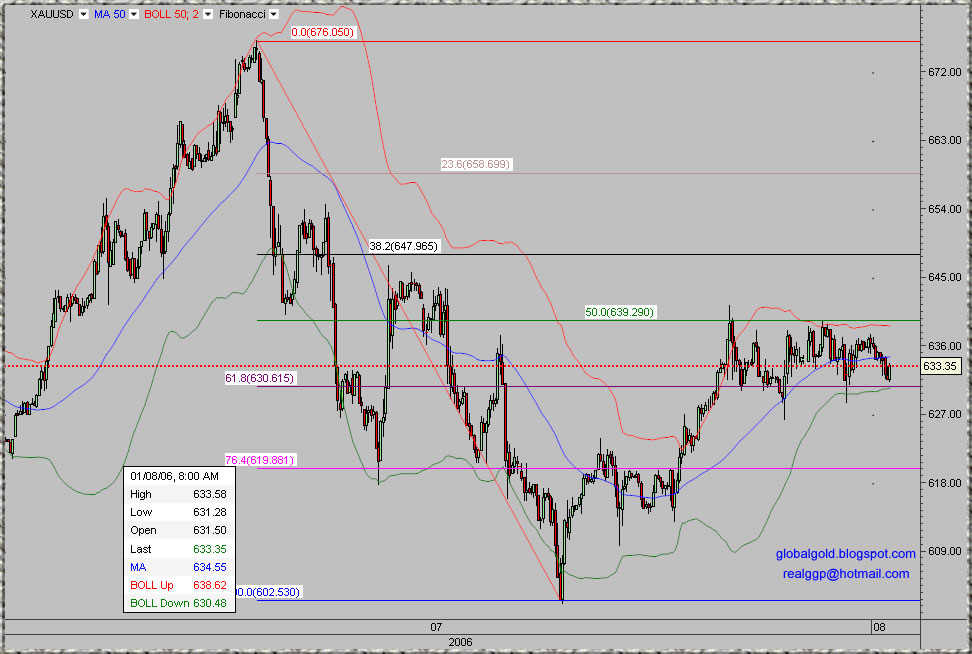
Tight trading range for gold ?
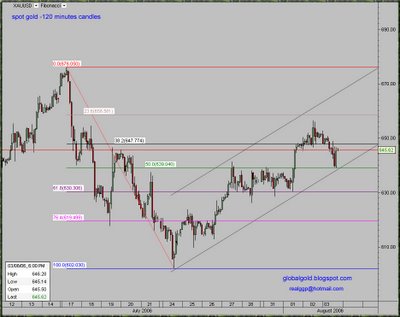
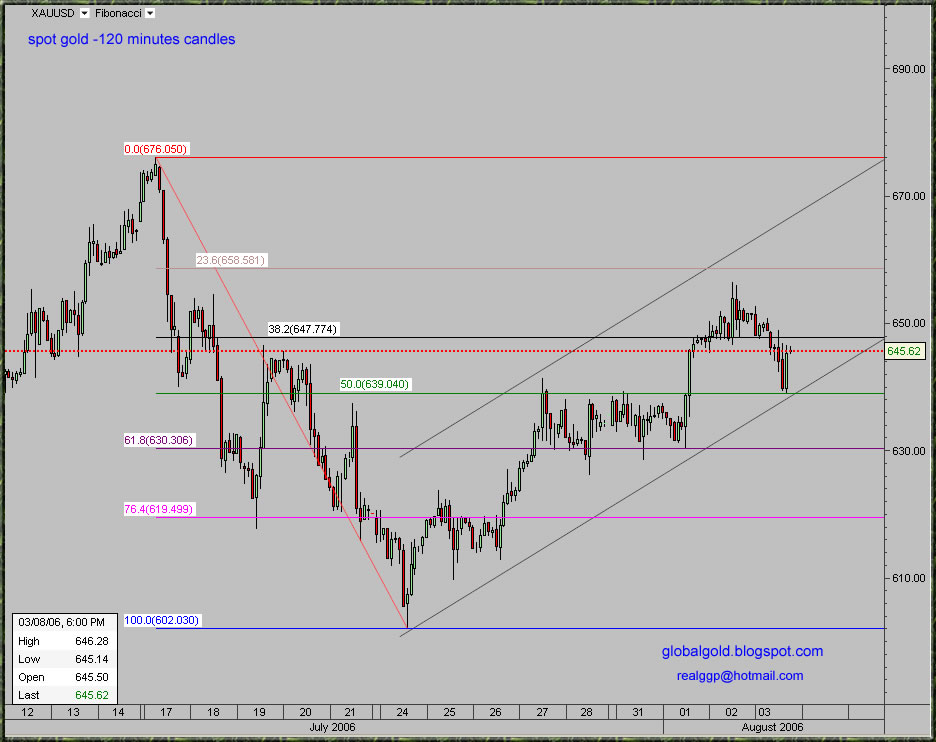
Last few days gold is trading in a relatively tight trading range, Bollinger bands (MA= 50, STD =2) on the one hour charts are tight and a breakout one way or another should soon follow. As previously said, I expect gold and silver to move higher but it is possible that gold will first move little bit lower (~620$) – a final speculators shakeout.
As you can see on the one hour spot gold chart below, the price of gold is trading between the 61.8% and the 50% Fibonacci lines (630$ - 640$). More support at ~620$(76.4%) and resistance at 648$(38.2%). As for the longer term picture for gold – No change and no need to update the daily and weekly charts I posted several times during the last week or so. (See the archive).
Click on the chart below for larger view.
Subscribe to:
Posts (Atom)
