Friday, June 30, 2006

Spot Gold (XAUUSD, XAUEUR) , Charts and Commentary

Gold finally show some real strength, closing the week just a bit above the Fibonacci 61.8% level and the exponential 50 daily moving average (50 MAE) on the spot gold chart I posted yesterday. The price action was so strong that even the upper resistance line on the channel chart failed to stop the gold rally.

The Bull market in gold is alive and raging but just like the rodeo it will not be an easy ride.

Next week we might see a pull back to the 76.4% Fibonacci level (~586$), consolidation around the current price or further rally to the 50% Fibonacci level (or higher). This is a wild bull market in gold and If my Elliott Wave analysis is correct this is Wave iii of 3 of III which can be extremely impulsive volatile and extensive.

Related:

Commodities Important news and charts - link

Gold and Silver Stocks reviews - link

Elliott Wave Tutorial (Free for EWI club members) -link

Here are spot gold XAUUSD ; XAUEUR one hour bar charts with 100 MA Bollinger Bands (STD=2).

Spot Gold XAUUSD chart

Spot Gold euro chart, XAUEUR

Thursday, June 29, 2006

Gold Chart & Gold Market Commentary

It was a good day for all financial assets including Stocks, Bonds and Commodities, Gold and Silver are up while the USD index is down. HUI the AMEX Gold Bug Index is up 7.79%. Investors and traders lost their fears and bought everything they could, cash piles are back at work as it seems.

I just noticed that the Bank of International settlements (BIS) have published a new paper on over the counter derivatives including gold and other commodities. I will study the report and publish my thoughts and conclusions. You can see my thoughts on the previous BIS OTC report here :
http://globalgold.blogspot.com/2005/12/great-gold-paradox-part-ii.html

Here is a link for June 2006 BIS OTC report

http://www.bis.org/statistics/derstats.htm


In my opinion gold is headed higher to new highs but it will have to struggle with resistance and profit taking along the way. Traders should concentrate on carefully buying bottoms and taking partial profits along the way. Gold is again above the 76.4% Fibonacci line which should provide good support for any impending pullback.

You can contact me regarding any issue - Email

gold chart

Wednesday, June 28, 2006

Spot Gold (XAUUSD) Elliott Wave Analysis – Update

Top international banks employees are being paid 5 figures salaries to predict an average gold price of 550$ by mid March 2009.

I say: those are pure lies with the intention to temporary derail this great global gold bull market and allow their employers to accumulate as much physical gold as possible. Later and at much higher gold price they will market it aggressively.

The amount of misinformation regarding gold is as large as the potential price appreciation and that’s quiet a lot!

Investors need not worry and continue to add gold positions on deeps – each one should do its own risk management and liquidity calculation. Short term traders can try to prudently catch gold market bottoms or wait for more bullish confirmation.

Below is spot gold half hour bar chart annotated with Elliott wave count (enlarge chart for better view)

Spot Gold (XAUUSD) Elliott Wave Analysis

Gold , Silver - Spot Intraday Charts

It was an interesting day for the gold market, the price of gold made a marginal new high for the week then pulled it all back, the CBOT contract volume was huge - 35,071 for the 100 oz August contract. This is speculation washout my friends – nothing more, nothing less. Gold will head higher when the time is right.

Technically both gold and silver are trading in a modestly raising channel with marginal higher lows and higher highs. This is consolidation pattern.

All fundamental factors are still in place, gold might surprise any moment with spectacular rally. Investors should not fear, there are 101 reasons to buy gold in a conservative way. Traders should be very prudent as timing the gold market is extremely difficult.

Here are gold and silver one hour channel charts with Bollinger bands and stochastic indicator. Click on the charts to enlarge:


Gold spot intraday chart


Silver spot intraday chart

Monday, June 26, 2006

Gold Spot Charts & Commentary


Gold encountered early selling pressure but somehow managed to overcome.

Some positive technical developments:

  • The price of gold managed to cross the diagonal downtrend resistance line coming from the 730$ top.
  • Gold is now again above the 76.4% Fibonacci line on the 8 hours chart.
  • The price of gold have constructed potential head & shoulder pattern on the 1/2 hour chart , the initial price target for the pattern is ~603$ per gold ounce.

    Few hurdles are standing on the way but the bottom should be realized by market participants.

    Enlarge charts for better view:

XAUUSD, gold spot 8 hours intraday chart

XAUUSD, gold spot 1/2 hour intraday chart

Gold , China & India

This two issues are potentially extremely significant:

Call to mix forex reserves
(Shanghai Daily)
Updated: 2006-06-26 10:19

China's bulging foreign-exchange reserves and massive holdings in US treasuries are prompting some economists and researchers to argue the nation should diversify part of its huge reserves into gold and oil.

China should consider buying more gold with its forex reserves to avoid any losses linked to possible devaluation of its US dollar-backed assets, two central bank officials said in a latest research note.

Using some of the forex reserves to buy gold could "maintain and raise the value of China's dollar holdings," Zhao Qingming from the central bank's Financial Research Institute and Luo Bin from its accounting department wrote in a note published in China Money Market this month.

Although it was still unclear whether the comment might signal any policy change by the People's Bank of China, the central bank, it has highlighted a growing concern over mounting risks in forex investments.

China has forex reserves of US$875 billion by the end of the first quarter this year, surpassing Japan's as the world's biggest.

The country now invests around 1.3 percent of its forex reserves in gold, or about 600 tons. That compares with 8,500-odd tons owned by the United States, which accounts for more than 70 percent of that country's forex reserves. -source


Mumbai: With two mutual fund houses planning to launch gold exchange traded funds (GETFs), investors can look forward to invest in a much safer asset class, after being taken on ride in the equity market.

Two Asset Management Companies (AMCs) UTI and Benchmark recently filed their offer documents with market regulator Securities and Exchange Board of India (SEBI) to launch GETFs, which invest in gold as its underlying asset and trades like any other exchange traded fund on the bourses. - source

Sunday, June 25, 2006

Gold & Silver Weekly Chart

The Gold Silver ratio (XAU / XAG) = ~ 56.63, Dow Jones Gold ratio ( Dow / Gold = ~ 18.78, Gold / Crude Oil = ~8.26.

If my Elliot Wave Count Is correct and the bottom is in (b of 3) both gold and silver are at the very beginning of an extensive impulsive wave c (or 3) of 3 which will be more wild and more extensive then any thing the gold and silver market have witnessed before in this great global gold and silver bull market.

Whether you are an Investor or a trader this are the most relevant Fibonacci lines for spot gold (XAUUSD) and spot silver (XAGUSD).

For reference please see this long term gold chart.

See gold and silver stocks (GG, SLW, AUY, TRE) chart analysis.

Free Elliot Wave Tutorial (For EWI club members).

(XAUUSD)Spot Gold weekly chart

(XAGUSD)Spot Silver weekly chart

Friday, June 23, 2006

XAU, XAG Intraday Elliott Waves

The Gold Silver ratio (XAU / XAG) = ~ 57.16, Dow Jones Gold ratio ( Dow / Gold = ~ 18.92, Gold / Crude Oil = ~8.24.


More gossip regarding China:

China can convert part of forex reserves to gold - central bank officials
06.22.2006, 09:24 PM

SHANGHAI (XFN-ASIA) - Two central bank officials suggested China can convert part of its foreign exchange reserves to gold holdings to head off risks from the depreciation of the US dollar, state media reported.

Converting part of foreign exchange reserves to gold can protect and increase the reserve assets, the official Shanghai Securities News reported,

citing an article written by Zhao Qinming, an official at the central bank's financial research institution and Luo Bin of its accounting department.

The article was published on the latest edition of China Money - a monthly magazine controlled by the People's Bank of China, the central bank, the paper said. – source

See HUI(potential)buy signals

It will take more time then I previously thought, but both gold and silver will head higher to new highs. I believe that an orderly appreciation in the price of gold and silver is welcomed and shouldn't pose no treat what so ever. – This is my opinion

Here are spot gold and silver intraday charts with Fibonacci lines and the Elliott wave count. Click on the charts below to enlarge:

XAU intraday chart

XAG intraday chart

Thursday, June 22, 2006

Some thoughts on the NEW US Buffalo 24-Karat (.9999) Gold Coin

Two days ago I posted the US Mint (Established 1792) press release regarding the Issue of the New American Buffalo 24-Karat (.9999) Gold Coin which is authorized by the Presidential $1 Coin Act.

I was thinking about this and discovered some interesting facts:

The new gold coin design mimics the design of the 1913 Buffalo nickel. Coincidently the Federal Reserve was founded exactly the same year – 1913.

As for the design – this are my thoughts:

1) The new Buffalo gold coin purity is upgraded vs the Eagle gold coin from .9167 to .9999 symbolizing that gold is getting more important monetarily – not less!

2) The Buffalo is the largest terrestrial mammal in North America, and one of the largest wild cattle in the world. Symbolize that this is indeed the Great & Wild Bull market in gold. Biologically the buffalo is part of the Bovine subfamily which is a diverse group of about 24 species spreading worldwide – symbolize that this is GLOBAL and Diverse Bull Market – all nations will participate.

3) The observe design feature an Indian head which symbolize and emphasize Wilderness and Leadership – gold will trade wild and will certainly lead.

There you have it, all the characteristics of this GREAT WILD GLOBAL GOLD BULL MARKET

hey! don’t forget silver :)


 Indian 24-Karat (.9999) Gold Coin Buffalo 24-Karat (.9999) Gold Coin

Wednesday, June 21, 2006

Gold - Rally Time?

Multiple Inverted Head and Shoulders Pattern suggest Initial price target of 608$ per gold ounce.

See : Crude Oil (WTI) Charts , Gold Stocks ETF GDX & XGD , Seven Metals about to Soar (by Sean Brodrick)

Click on the chart below to enlarge:


gold spot chart

Monday, June 19, 2006

Silver(XAG) Chart

Silver like gold presents rare buying opportunity. Silver lost 37.67%(15.21- 9.48)with the recent sell off and touched its 200 DMA (daily moving average). Both RSI and PPO are in low level not seen since Q2-2004. The downside for silver is very limited while the upside potential is HUGE. In my opinion the best exposure to the price of silver is physical silver and the SLV ETF.

Gold vs. Gold Stocks, GOLD/XAU Ratio

Silver(XAG) Chart

Sunday, June 18, 2006

Chinese Gold & Silver Exchange to establish 24-hour electronic trading platform

The Chinese Gold & Silver Exchange plans to establish a 24-hour electronic trading platform and complete the transformation of the registered society into a jointly owned enterprise paving the way for a listing on the Hong Kong stock exchange.

"I hope to launch the 24-hour electronic trading platform as soon as possible so that we can pull back the transactions which are now taking place outside the exchange," said Lee Tak- lun, after being named the newly elected president of the bullion exchange.

Lee said directors are now looking for strategic partners with a background in gold trading, or even with expertise in electronic trading.

The group needs to forge solid partnerships to push forward plans including the introduction of an around- the-clock electronic trading platform and the launching of a gold transactions registry.

It is also aiming at the strengthening of relationships with the People's Bank of China as well as the Shanghai gold exchange, Lee said.

The exchange also proposes to launch a real gold delivery system to boost turnover, he added.

Explaining the low turnover of the bullion exchange, Lee said that since transactions are in Hong Kong dollars, trading is largely local.

As for the proposed gold depository, which is expected to be located at Hong Kong International Airport, the exchange will cooperate with the government to bring it to fruition smoothly, Lee said. - source

gold coins at hand

New American Buffalo 24-Karat Gold Coins

The United States Mint is pleased to introduce its new line of 24-karat gold coins.

Production of these highly anticipated coins is authorized by Public Law 109-145, dated December 22, 2005, also known as the Presidential $1 Coin Act.

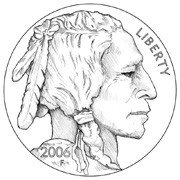
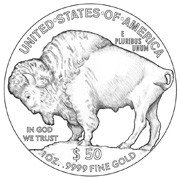
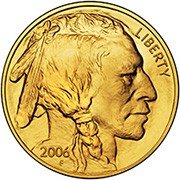
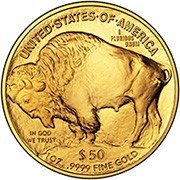
The new American Buffalo Gold coin’s obverse and reverse designs feature images originally prepared by noted American sculptor James Earle Fraser, once a student of Augustus Saint-Gaudens, for America’s 5-cent coin (nickel).

That popular coin, known as the Indian Head, or Buffalo, nickel was introduced in 1913 and showcases the native beauty of the American West.

The Native American depiction on the coin’s obverse is believed to be based on three different Indian chiefs – two of whom were named by the designer as Chief Iron Tail and Chief Two Moons – who modeled for Fraser as he sculpted its design. Conflicting statements exist on the third Indian as being either Chief John Big Tree of the Onondaga tribe, or John Two Guns, son of White Calf. It is widely believed that the bison on the coin’s reverse was modeled after "Black Diamond," a popular attraction at the New York Zoological Gardens.

In the first year of the coin’s issuance, 1913, there were two distinct varieties, the first showing the bison on a mound and the second with the base redesigned to a thinner, straight line. American Buffalo Gold Coins bear the original Fraser Type I design.

United States Mint American Buffalo Gold Bullion Coins

American Buffalo Gold Bullion Coins are the first .9999 fine 24-karat gold coins ever struck by the United States Mint and offered for sale through a network of Authorized Purchasers. These $50 gold coins will be available to members of the public seeking a simple and tangible means to own and invest in 24-karat gold in the form of legal tender coins whose content and purity is guaranteed by the United States Government.

American Buffalo Gold Bullion Coins will be available at many coin and precious metals dealers as well as many brokerage houses and participating banks. Pricing for precious metal investment coins typically depends on the market price of the metal. Click here to locate a dealer.

United States Mint American Buffalo Gold Proof Coins

The United States Mint will produce a proof version of these coins for collectors. The term "proof" refers to a specialized minting process that begins by manually feeding burnished coin blanks into presses fitted with special dies. Each coin is struck multiple times so the softly frosted and highly detailed images seem to float above the field.

An official Certificate of Authenticity will accompany each coin. American Buffalo Gold Proof Coins will sell at a fixed price and can be purchased directly from the United States Mint.

Product Information

All 24-karat American Buffalo Gold coins will be struck at the United States Mint at West Point . The 24-karat American Buffalo Gold Bullion Coins will be minted and sold in the same manner as American Eagle Bullion Coins . - source

New American Buffalo 24-Karat Gold CoinNew USA Buffalo 24-Karat Gold Coin

Friday, June 16, 2006

Long Term Gold Chart - Elliott Wave Analysis

It is time to look again at the long term gold chart. Since the gold standard ended at 1971 gold is not officially backing any national currency.

The market reaction to the end of the official gold standard was a ten years bull market rally (wave 1) that took gold from 35$ to ~850$ (2300%) . The gold peak of 1980 followed by a twenty years gold bear market that took the price of gold as low as ~250$ (wave 2) , 600$ (70%) decline. The gold price bottomed around 250$ and then it rallied almost 200%, this is the third major Elliott wave. Wave three usually tends to be extended both in time and price.

If the third Elliott wave will match the first Elliott wave then the top of the third wave should be around 6000$ per gold OZ - I know that’s sounds unreasonable right now but that is a conservative target based on pure Elliott wave analysis.

If you are new and interested with Elliot Waves - see this excellent Elliott wave tutorial by EWI (free registration is required).

Here is a gold price fix chart with Elliott wave count. Looking closely at the chart, the price of gold is behaving similarly to 1973. (Click on the chart to enlarge)

Long Term Gold Chart - Elliott Wave Analysis

Thursday, June 15, 2006

Gold Market Update

Gold and Silver are deeply oversold and thus present a rare buying opportunity.
The devastating 188$ sell off have cleaned most of the speculative long gold positions and attracted speculative short gold positions. This is the time to be cautiously bullish. Long term Investors (savings) should just take a position and hold it for years to come. I highly recommend that you get at least some physical gold and keep it handy.

Traders should be extremely careful and manage risk wisely. I do not recommend trading gold for no one but the most professional experienced traders. Holding a long term gold short position is a death wish in my opinion. Is this time shorts are going to sweat? – time will tell…


Technically Gold have completed an Impulsive extended correction wave 2 of [3]. The next up move could be quiet long (3 0f [3]) and there is a good chance it will extended more then 313$ and will probably challenge the all time gold price high(1980). Interesting times head.

Click the chart below to enlarge:


spot gold chart, XAU

Wednesday, June 14, 2006

Gold Global Perspective > Licking the wounds…

It's difficult to be bullish on gold in the face of a 180$ one month decline. I feel your pain (or gain) and my only offer is to count your ounces - If you got any left…

The year is not even half done and the price of gold rallied 200$ then gave it almost all back. – Interesting to say the least.

Mr. Gary Dorsch published an Interesting article: Central Bankers declare War on Gold and the “Commodity Super Cycle” - you can read it @ gold seek.

Feel free to browse the archive

Click on the chart below to enlarge

Gold spot daily chart

Friday, June 09, 2006

Gold and Silver Charts

Another Bad week for metals including gold and silver. The Gold Silver ratio (XAU / XAG) = ~ 54.36, Dow / Gold = ~ 18.09, Gold / Crude Oil = ~8.42. Officials made irrelevant comments – many players misinterpreted the comments and got scared, The Market is cheering with 130$ gold Sell off , Gold in terms of Yen is back to the February high. Some predict bear market for commodities. Stock market crash in India, Russia and Saudi Arabia- did I miss something?

For the Weekend :
Platinum & Palladium charts , some PMs buying opportunities , Elliott Wave International Crash Course (needs short registration) - highly recommended !

Happy birthday to Sergio Cámara!

Click on charts below to enlarge:


siver spot weekly chart
gold daily chart
gold yen chart

Thursday, June 08, 2006

XAU , Spot Gold daily chart

Gold in terms of USD is down to the 61.8 Fibonacci level which is close to the 100 EMA and a the slight uptrend support. See also - Gold stocks indices.

XAU ,Spot Gold chart

Spot Gold Weekly chart , Global Crash

I observe Global crash environmental conditions, targeted liquidity shocks, plague symptoms. This is an ongoing global market game of crash and enlarged cash piles lost in the dark, .New banking regulations and waves of bankruptcies might soon follow. Raise liquid cash and be sure to have some physical gold. Buying opportunities will soon pop all around. Elliott Wave International just released a timely on going Crash Course; see also Conquer the Crash by Bob Prechter (EWI founder) - Excellent composition which is easy and highly educating. This is a must read book for most people.

Related : To melt or not to melt: That's the coin question...

Here is Spot Gold weekly chart with Fibonacci retracement lines and Uptrend support:

Spot Gold Weekly chart

Cash Piles

China, Japan, Taiwan, RF lead in gold, forex reserves

08.06.2006, 11.28
XIANGGANG, June 8 (Itar-Tass) - - China, Japan, Taiwan and Russia are in the lead in the world in the volume of gold and foreign currency reserves, says a comparable report prepared by the Hong Kong Currency Department on the basis of the latest statistical data from different countries.
Of late, the biggest holder of state foreign currency reserves has been China which has more than 875 billion dollars. Japan, whose reserves were estimated at 864.1 billion dollars at the end of May, occupies the second place. Taiwan, whose reserves are equal 260.9 billion dollars, ranks third, and Russia with reserves of 247.3 billion dollars - - fourth. -source

Russia gold trading

Russia exchange embarks on gold contract trading

08.06.2006, 12.34

MOSCOW, June 8 (Itar-Tass) - The Russian stock exchange RTS began gold contract trading on Thursday.

The first deal on gold contracts on the commodity market (futures and options at RTS) falling due in July and September has been concluded at the price of 626.5 dollars an ounce, the RTS public relations department said.

Settlements on the gold future contracts are made in roubles using opening gold prices at London fixing.

The size of collateral is 5 percent of the cost of a contract, and charged commission is 1 rouble, PRIME-TASS said.

The gold futures simultaneously represent an object of capital investment, an accumulation tool and a speculative tool.

They are also a valuable expedient for commercial producers and gold users.

In convenience of asset sale and purchase and transaction costs, the futures contracts are superior to other modes of investment in gold. ITAR-TASS

Tuesday, June 06, 2006

XAU , XAG Intraday Charts

Gold and Silver spot charts, slightly bullish intraday indicators, doesn't mean much yet - but it might be useful for some visitors.

* Fundamental note: Remember that at the end of the day: High interest rates does not effect in any meaningful way the geological structure or the technology development – it could however damage consumerism, real long term investments and pressure debts.

Click on the charts below to enlarge:

XAU Intraday Chart
XAG Intraday Chart

XAGUSD, Spot Silver Charts

Here is a look at the silver weekly and daily charts with some trend lines and Fibonacci numbers.


XAGUSD, Spot Silver daily chart
XAGUSD, Spot Silver weekly chart

Monday, June 05, 2006

XAUUSD, Spot Gold Elliott Wave Count Analysis

The Gold Silver ratio (XAU / XAG) = ~ 50.66, Dow / Gold = ~ 17.44, Gold / Crude Oil = ~8.75. Gold have pulled back 112$ since it's recent top and there are three red candles in a row for the first time since what I "believe" is the start of the Third wave up. Obviously there is a serious technical damage and this correction is the largest the gold market has seen since the beginning of the third wave up. Nevertheless I do not think that the gold market fundamentals have changed and I still see great opportunity in buying gold. Here is a Weekly spot gold chart annotated with Fibonacci lines and new Elliott Wave count:

XAUUSD, Spot Gold weekly chart

Search

SUBSCRIBE

Gold Global Perspective Feed

AddThis Social Bookmark Button AddThis Feed Button

Archive

Labels