Wednesday, May 31, 2006

Gold , Euro , Yen , Silver & USDX Charts

Gold and silver moved downwards while precious metals stocks moved higher. This is the Great Global Gold & Silver Bull Market and the metals will move higher in each and every national currency. Both gold and silver are accelerating and the volatility can get much higher. When to buy / sell or just hold is highly dependent on who you are and what your style is. I'm just holding and buying the deeps, ~100$ sell off is deep enough for me. The Gold Silver ratio (XAU / XAG) = ~51.44, Dow / Gold = ~17.39, Gold / Crude Oil = ~9.02.


Gold and Silver Mining Stocks

Commodities Charts

Elliott Wave Tutorial

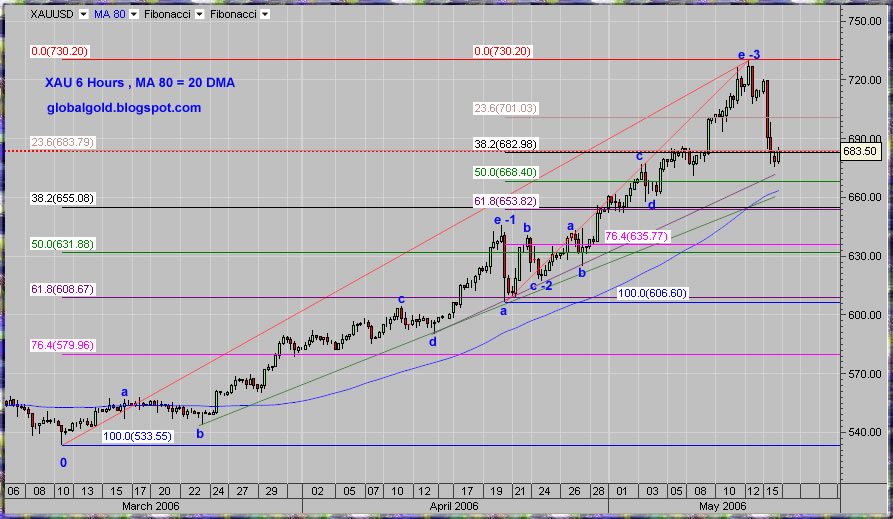
Here are some charts of Gold in Euro, Yen, US Dollar Index & Silver.

Spot Gold USD

XAUJPY, Spot Gold Yen

XAUEUR, Spot Gold Euro

XAGUSD, Spot Silver daily chart

XAGUSD, Spot Gold Intraday

US Dollar Index, USDX

Tuesday, May 30, 2006

XAU XAG Bullish Bias

Silver looks flaggy, have done some Elliott work with no final conclusion yet, but its hard to find a bearish wave count – If you get one please send it to me. On the broad view- it may be very hard to find an asset which has such a long term bullish formation like gold, on a second thought maybe silver if you discount liquidity. The gold market is entering a period of accelerated movements which will results in sharp and devastating sell offs but the price resolution will be pretty steady to the upwards – in this third wave which is half done at most – many new market participants starting to get in, this is the time that people who never thought about buying gold start to feel uncomfortable – the uncomfortably can be settled by buying gold. The recognition is eye opening , the knowledge might bring understanding.

Here some gold related news:

Growing over-the-counter gold trading a legal gray area in China

Shanghai. May 30. INTERFAX-CHINA - Many Chinese companies engaging in over-the-counter (OTC) gold trading are operating in legal limbo as current options cannot satisfy demand.

The Shanghai Gold Exchange (SGE) is the only institute authorized by the government to conduct gold trades. Those gold trades can only be carried out among SGE members, including banks and gold refiners and clients.

Many domestic gold investment companies (gold dealers) that are not members of the SGE, directly conduct OTC trades, which are over the telephone or by computer on the overseas markets. -source


MPS want 'online gold trading' to be stopped

(Press Trust of India Via Thomson Dialog NewsEdge)Madurai,May 29 (PTI) A Group of MPs have appealed to the Centre to immediately stop "online gold trading," which they described as "gambling" and "affected marriage of women in middle class families." In a memorandum to the Prime Minister, a copy of which was released to the media here, 12 Mps from Tamil Nadu, West bengal and Kerala said traders across the world were earning crores of rupees through their "monopolistic online trading", and they were mainly responsible for the steep hike in gold prices. -source


Gold is safe to invest in, say experts

Our Regional Bureau / Mumbai/ Ahmedabad May 30, 2006

Gujarat Chamber of Commerce & Industry and H L College Alumni Association, jointly organised a seminar on Current and Future Trends in Capital, Commodity and Metal Markets in city on Sunday.

C Chakrabarty, head of training and R&D, MCX said MCX has grown tremendously with its turnover increasing to Rs 10,000 crore and made an impact on the stock market.

He said gold is a safe commodity, high liquidity asset and also an international currency having world wide value acceptance. source


Charts below clickable:

XAG spot silver chart


XAU spot gold chart

XAU spot gold

Friday, May 26, 2006

Gold Market News , Chart

Persian Gold agrees Iran gold option deal
May 26, 2006 12:36

Persian Gold, the Irish based AIM listed Iranian gold explorer, has agreed an option deal in the Chah-e-Zard gold project. This is located in Yazd, some 350 miles southeast of Tehran.

If exercised, the option has an initial period of nine months and will allow Persian Gold to acquire a 70% interest in a new company to be established to hold the licence on the property. -source


Rio Tinto withdraws from Iran gold mine
May 24, 2006 - 9:39PM

Anglo-Australian miner Rio Tinto said it was pulling out of the Sari Gunay gold mining project in western Iran after deciding it was not commercially viable. - source

Interesting Site ? - Islamic Arts and Architecture (IAAO)


Thank you all! & Good weekend to everyone.

Click chart to enlarge:

XAU - spot gold intraday chart

Thursday, May 25, 2006

Gold and Silver Mining Stocks: GG, Gold Corp Inc. at 25% discount !

Gold and Silver Mining Stocks: GG, Gold Corp Inc. at 25% discount !


Recommended gold related readings (If you have the time…) :

Backfire On Corrupted Price Index By Jim Willie CB

Monetary versus Non-Monetary Commodities By Antal Fekete

Tomorrow's Gold: Asia's Age of Discovery by Marc Faber

JSMineSet.com Jim Sinclair’s Commentary

Socionomics: The Science of History and Social Prediction Why do trends in society often change so rapidly and dramatically? - See Video at socionomics.net

Gold & Silver News, Spot Silver Chart - XAG

Indian Bank to sell gold coins to boost profit
006-05-25 17:15
By Ruchira Singh
MUMBAI (Reuters) - Government-owned Indian Bank is hoping to set the slot machine ringing with the gold coin. In an attempt to boost business, the nearly 100-year old bank is stepping up retail sales of its recently launched gold coins, targeting a net income of 100 million rupees by the end of the fiscal year- source

World demand for silver soars
By Eileen Alt Powell
THE ASSOCIATED PRESS
NEW YORK — Demand for silver rose in 2005 to the highest level in five years as strength in jewelry and industrial products offset softness in photography and coins, the Silver Institute said Wednesday. The Washington, D.C.-based industry group also said its annual survey indicated that investor demand for silver has been increasing, just as it has been for gold. -source

Russia gold and currency reserves reach about 237 bln dlrs
5.05.2006, 10.05
MOSCOW, May 25 (Itar-Tass) - Russia’s gold and foreign currency reserves increased by 600 millon dollars (or by 0.25 percent) to reach 236.7 billion dollars in the period from May 12 to 19, PRIME-TASS reported on Thursday with reference to the Central Bank of Russia.

The reached size of gold and currency reserves is another record for the whole period of regular publications of this information by the Central Bank of Russia.

As compared to January 1, when the volume of Russia’s gold and foreign currency reserves was equal to 182.2 billion dollars, this figure has increased by about 29.9 percent. - source


Spot Silver chart annotated with Fibonacci levels, trend lines
and Elliott Wave count. Click on the chart below to enlarge:

XAG spot Silver chart

Gold Spot Chart May 25 2006

Refer to this post Gold @ new multi year highs... Good luck to all.

Click on the chart below to enlarge:

XAU , SPOT Gold Chart

Wednesday, May 24, 2006

Gold Market Commentary, Chart

Marginal [e] lower then [c] is obviously a given, important notice should be taken of this Fibonacci levels. As for buying, selling and holding recommendation: In general the fundamentals reasons to own gold and silver have not changed at all, they are just getting stronger. Intraday short term traders – good luck if you can challenge the volatility and catch the majority of the moves. Trading gold is not advised to anyone but the most professional with suitable experience and capital , the big majority will do better with holding at least most of their positions for the duration of this Great Global Gold Bull Market. After all not everyone wants to seat on knifes in this kind of market. Not so is the case for Gold Mining stocks - this you should monitor constantly and treat with much more care and attention – All Gold stocks might be subject to mining stocks special risks along the usual frauds. – Gold is a rare metallic mineral – with thousands years of monetary role. Most of the above apply to silver. One more thing – much of your strategy should be dependent on your age and the sources of your cash flows.


Back to the short term technical's – Silver some weakness not much change , gold – see chart below ( you can click to enlarge)

Spot Gold Chart

Gold and Silver News

CBOT Expands Silver Complex and Launches Full-Sized Silver Futures Options
The Chicago Board of Trade (CBOT) announced today it will expand its Silver Complex by launching a new options contract on its CBOT Full-sized (5,000 oz.) Silver futures contract. The new contract will trade exclusively on the Exchanges premier electronic platform from 6:16 p.m. to 4:00 p.m. (CST) and is scheduled to begin trading on Monday, June 12, under the ticker symbol of OZI. -source

World Silver Survey 2006 Summery
The World Silver Survey contains a global analysis of the world's silver markets and has been produced by GFMS on behalf of The Silver Institute in Washington since 1994 -link

Anglo to dump all of AngloGold
Posted Wed, 24 May 2006
Anglo American will have completely disinvested in AngloGold Ashanti in up to three years, the group said on Tuesday.

According to Anglo American spokesperson Anne Dunn, nothing had been finalised as yet as to how it would go about disinvesting in the world's number three gold miner.

In October last year, Anglo said that because gold assets were valued differently from its other mining assets, and therefore attracted a different set of investors, it would sell its stake in AngloGold.

Since then Anglo dumped some 20 million shares in AngloGold, but still holds a 41.8 percent stake in the gold miner.

Anglo American shares gained 7.94 percent on the JSE on Tuesday, while AngloGold picked up 3.47 percent. -source

I will post gold and silver charts later...

Tuesday, May 23, 2006

Gold & Silver Market Update , Charts

Gold and Silver, metals and most commodities had relatively strong upward movement today. The Gold Silver ratio (XAU / XAG) = ~ 51.54, Dow / Gold = ~ 16.67, Gold / Crude Oil (Light Sweet Crude Oil Future July 2006) = ~9.35.

Technically it is still unclear if the price of gold is headed for lower low ( [e] lower then [c] ) or else the bottom is in and higher highs will follow. For basic yet excellent Elliott wave tutorial see EWI – might need registration. What else ? - See this Interesting Gold Market report.

Click on the charts below to enlarge:

Spot Silver chart

Spot Gold chart

XAU , Spot Gold Chart Update

I see a potential strong gold rally in the make.
See Gold & Silver Stocks

Click on the chart below to enlarge:

XAU , Spot Gold intraday Chart

Monday, May 22, 2006

XAU , Spot Gold Charts Update

BlueFlix (follows Elliott wave) said: "Gold fundamentals are there and getting stronger. But, in the intermediate term, gold may be correcting to its 200DMA..."

Well I agree about the fundamentals part, as for the 200DMA (about 530$) I think It is very pessimistic view and gold will have to retrace the whole impulsive extensive wave since March low(~535$). off course [e] low (lower then [c]) might be coming but the price of gold didn't even touched it's 50DMA (~620$) yet so it very early to call for the 200DMA. In my opinion the Fibonacci retracement levels are the thing to watch along the 630$ – 640$ horizontal support level. For Elliott wave tutorial see EWI.

See: AMEX Launches New Gold Miners ETF GDX - by Van Eck Global

Click on the charts below to enlarge:

XAU , Spot gold intraday chart

XAU ,Gold Spot intraday chart

Gold Market News

Do you feel the concentrated efforts to scare the market and calm down speculation in all markets by authorities and international banks?

To some degree Interests rates and short term liquidity can be controlled. however some of the market fundamentals can not be manipulated. Therefore it is still a good idea to look for trading and investment opportunities in all markets especially commodities with bullish fundamentals and favorable supply demand conditions.

Regarding Gold, here are some of the latest global gold market news from around the world:

RTS to launch gold, oil futures June 8

MOSCOW. May 22 (Interfax) - The Russian Trading System (RTS) will launch futures and options in gold and oil on June 8, the RTS said in a press release.

"We plan to launch oil and gold futures in June," Jacques Der Megreditchian, the RTS board chairman, told Interfax earlier. These will be the first in a series of planned commodity futures, he said. The RTS will base its settlement prices for oil futures on quotations from the Platts agency, he said.

Troika Dialog, an investment company where Der Megreditchian is managing director, said Troika Dialog would be the market-maker for the contracts. "We'll be acting as the market-maker and we'll be hedging in London and New York," he said.

The RTS also plans to trade futures in diesel fuel, aviation fuel and fuel oil. -InterFax

Indian first Gold Fund

Posted: Sun, 21 May 2006
[miningmx.com] -- DETAILS of India's gold-backed equity were released to the market after the scheme's backer, Benchmark Mutual, filed papers with the Securities and Exchange Board of India.

The scheme, which is effectively India's first exchange traded fund (ETF), said the scheme includied plans to impose levies on entry and exit from the ETF.
The Financial Express, a Mumbai newspaper, said the product would levy a 4% entry load and 3% exit load on the Gold Benchmark Exchange Traded Scheme (Gold BeES), as the product is called.

Gold BeEs is an open-ended scheme that will list on the National Stock Exchange (NSE). Like the exchange traded fund it will invest in physical gold, the Financial Express said.
"The scheme seeks to generate returns that closely correspond to the returns provided by the domestic price of gold. At least 90% of the corpus will be held in physical gold, while the rest can be deployed in bonds and money market securities," the newspaper said. Each unit of Gold BeES will have a face value of Rs 100. Minimum investment is Rs 10,000 and in multiples of Rs 1,000 thereafter, it said. - source

Saudi firm buys gold from African central bank

Mon May 22, 2006 12:24 PM GMT
RIYADH (Reuters) - A private Saudi jeweller has bought 36 tonnes of raw gold from an African central bank for 1.8 billion riyals, a company spokesman said on Monday, confirming a newspaper report.

When asked about the report in leading Saudi business daily al-Eqtisadiah, the spokesman said: "That is correct."
He declined to elaborate.

The newspaper quoted Suleiman al-Othaim, board chairman of the Riyadh-based al-Othaim Gold and Jewellery firm, as saying the gold would be delivered in the fourth quarter of this year.
"The deal was concluded directly (with the unidentified African central bank) without any intermediary," the newspaper quoted him as saying.
It did not say when the transaction took place. -source

See Uranium & Titanium Stocks: CCJ , TIE

Sunday, May 21, 2006

Lordi (Finland) is the winner of Eurovision 2006

Little bit entertainment for the weekend, Eurovision 2006 Winner - Finland.

Artist : Lordi (Finland)
Song Title: Hard rock hallelujah
Composer : Mr. Lordi
Lyricist : Mr. Lordi


Saturday, May 20, 2006

Gold and Silver Mining Stocks -Few Gold, Silver stocks charts for the weekend

Gold, Commodities Blame Game?

See this story : Zimbabwe Jan-April gold output tumbles by a third

MUMBAI (Reuters) - Benchmark Asset Management Co. Pvt. Ltd. on Friday filed papers with India's market regulator for approval to launch an exchange-traded gold fund.
In its initial offer document, Benchmark said the fund would track the domestic prices by investing in physical gold.
Each unit of 'Gold Benchmark Exchange-Traded Scheme' would be equal to the price of one gram gold.
The unit would have a face-value of 100 rupees and priced around the value of gold, Benchmark said in a document filed with Securities and Exchange Board of India. (SEBI).
In January, SEBI allowed mutual funds to launch gold-backed schemes in a country which has a vibrant physical market fueled by tradition.
UTI Asset Management Co Pvt. Ltd. had also said it would launch an exchange-traded gold fund. - source

Rhodium Price ?

Friday, May 19, 2006

Gold and Silver charts (XAU, XAG)

So it goes… needless to say the last trend line support did not hold and gold lost another 20$. Not that bad – Gold rallied almost 200$ in two month and now gave back ~38% of the move, on the positive side the price of gold closed just above the Fibonacci 38.2% support. Silver constructing a box formation. Both still present excellent buying opportunity in my opinion and higher prices will soon follow. I annotated a spot gold and silver charts with Elliot wave count, click on the charts below to enlarge:


XAG - silver price chart


XAU gold price chart


S.Africa gold output tumbles
Allan Seccombe
Posted: Fri, 19 May 2006
[miningmx.com] -- SOUTH African first quarter gold output fell 10.9% year-on-year to 68 tonnes, and despite the local gold price soaring by a third in the period, there are five mines that are marginal, the Chamber of Mines said on Friday.


"South Africa’s gold production in the first quarter fell by 10.9% year-on-year to 68 tons on the back of the lower number of production shifts available to mines and in terms of the continued restructuring on certain operations," the Chamber said.

The fall was 9.5% quarter-on-quarter.

"Despite the rand gold price rising by 32% to an average of R109 219 per kilogram in the first quarter of 2006, five mines employing 53 708 employees and producing an annual 57.2 tonnes of gold were still marginal before capital expenditure," the Chamber said. - source


Good weekend to all !

To melt or not to melt: That's the coin question...

Interesting story coming from Taiwan:

2006/5/19
The China Post staff

To melt or not to melt: That's the question.

Well, it's the question of the day.

What to melt?

Small coins, of course, now that the prices of copper, nickel and aluminum have soared just as gold and silver did.

Whether the melting has started in Taiwan on a scale large enough to cash in on the surge of metal prices is not known, but non-numismatist entrepreneurs certainly are looking into the possibilities of amassing a trove of small change to make the quick buck.

With the gold price hitting US$700 an ounce, one kilogram of lowly nickel can fetch close to ten pounds sterling -- 9 pounds 45.7 pence to be exact -- in London, where the same weight of once cheap copper is sold at three pounds 89.6 pence.

Ubiquitous aluminum? One pound 35 pence a kilo.

That makes it lucrative to get hold of at least one million NT$1 coins, melt them and sell them as ingots, according to an enterprising newly converted numismatist.

"You spend only NT$1 million," says the entrepreneur. "And you get NT$1.26 million."

But he doesn't say he has set up shop.

It's much better to melt half-dollar NT coins, he adds.

They are a little smaller in size than the NT$1 coins, but a half-dollar melted is worth NT$0.93 or 43 cents more than its par value.

The reason is that you have to have at least 3.8 metric tons of change to make your melting business go. You spend much less to get that much if you collect only half-dollars.

That is not quite right, the Central Bank of China points out.

For one thing, it's against the law.

Anyone found to have purposely destroyed the legal tender shall be sentenced to not over one year but not less than seven years in prison, the law says.

Moreover, a Central Bank expert says, it's not profitable at all to melt and sell.

The expert continues copper accounts for 92 percent of the 3.8 tons of NT$1 coins. They contain 6 percent of nickel and 2 percent of aluminum.

"In other words," the Central Bank official goes on, "there will be 3.496 tons of copper, 228 kilograms of nickel and 76 kilograms of aluminum."

Sold on the London market, they would bring in only NT$952,738. The breakdown is NT$817,225 for copper, NT$129,371 for nickel, and NT$6,142 for aluminum.

The net loss is NT$47,262. If freight is added, the loss will be even greater.

Wait a minute, the entrepreneur says.

"He may be right," the enterprising numismatist adds, "but you will do much, much better, if you collect the old NT$1 coins."

The old coin, known as the plum change for the flower on the back side, is no longer in use as the legal tender. "You don't have to worry about the long arm of the law," he adds.

It's heavier, six grams against only 3.8 grams of the coin in circulation.

As a result, NT$1 million worth of plum coins weigh up to six metric tons, of which 3.3 tons are copper. There are 1.08 tons of nickel and 1.62 tons of aluminum.

Altogether NT$1,904,164 will be made by getting NT$1 million worth of plum coins, melt them and sell them in ingots in London.

And there's a historical precedent.

In 1973, copper and nickel prices soared, and so many plum coins were melted and sold in ingots in Taiwan that an acute shortage of change resulted.

Butchers and grocers in Taipei came up with a clever way to make up for the shortage of change they have to give back to overpaying customers.

They printed their NT$1 IOUs. Their customers gladly accepted them. - source


Thursday, May 18, 2006

Gold Market update

The Gold Silver ratio (XAU / XAG) = ~ 53.72, Dow / Gold = ~ 16.31, Gold / Crude Oil future = ~9.77. Gold is down about 50$ since the most recent peak (~730$). The pullback is purely technical and the gold market fundamentals have not changed.

Technically there is one last relevant short term trend line in place if it doesn’t hold then watch for horizontal support and Fibonacci lines. If I had to put a short term trade: It will be at current price with a stop just below the 20 DMA. Investors, Shorts and those who hold no position in gold should use any weakness and buy.

Click on the chart below to enlarge (FireFox browser highly recommended – link for download at the left bottom of this page)

gold price spot chart

Wednesday, May 17, 2006

Nasdaq Gold ratio

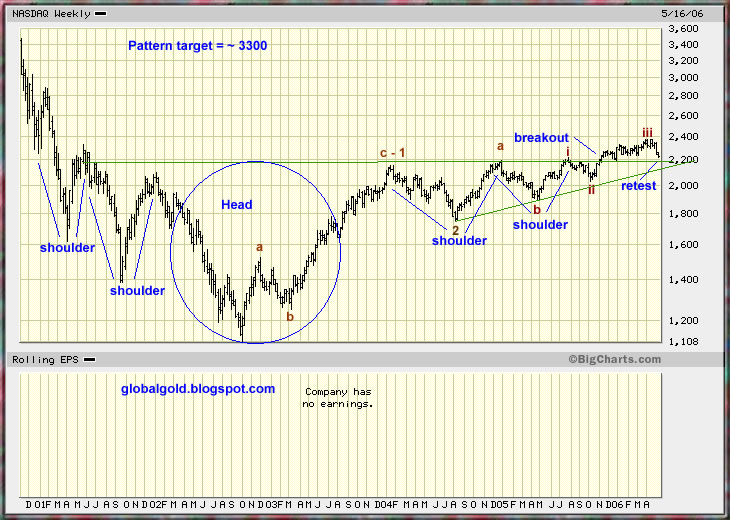
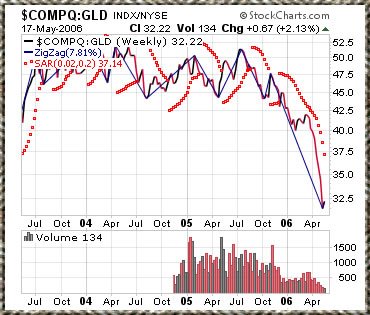
It's easy to be bearish on the stock market with the sharp sell off the last few days and interest rate at 5 years high. However I think that the NASDAQ is close to a short term important bottom and a rally to new highs might surprise. In my opinion gold will continue to outperform the NASDAQ (as well as the other indices) but higher gold price will also allow the stock market to go higher. To put it simple: The stock market will continue to go up (Bull market) but it will go down relative to the price of gold(Bear market), I also expect the NASDAQ or QQQQ volume to go down relative to GLD volume.

Here is a NASDAQ chart annotated with Elliott waves count (current wave iv of c of 3), I see a potential Inverted Head & shoulders formation and the target is ~3300. Click on the chart below to enlarge

Nasdaq weekly chart

Nasdaq Gold ratio chart

Spot Gold Chart

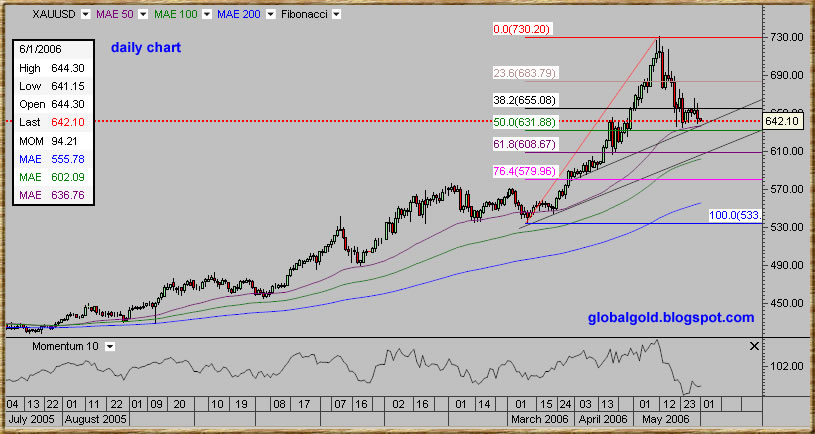
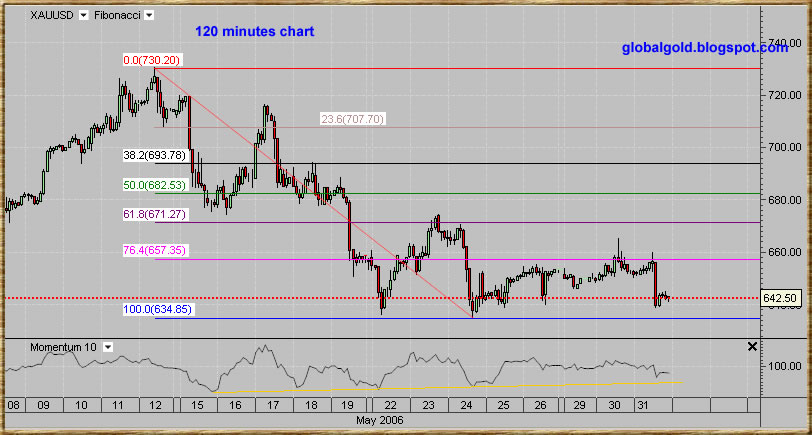
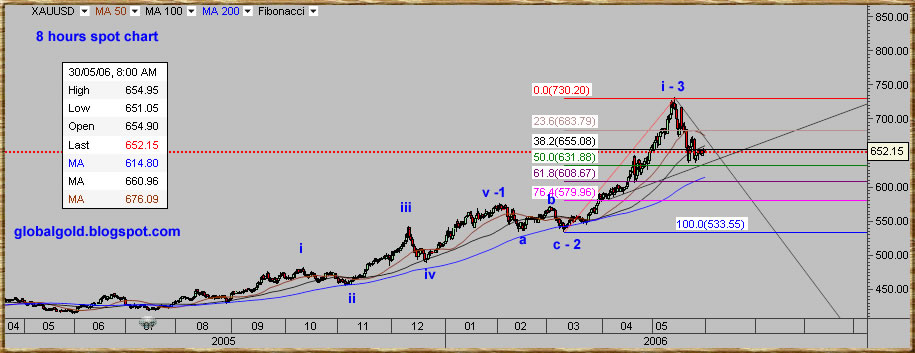
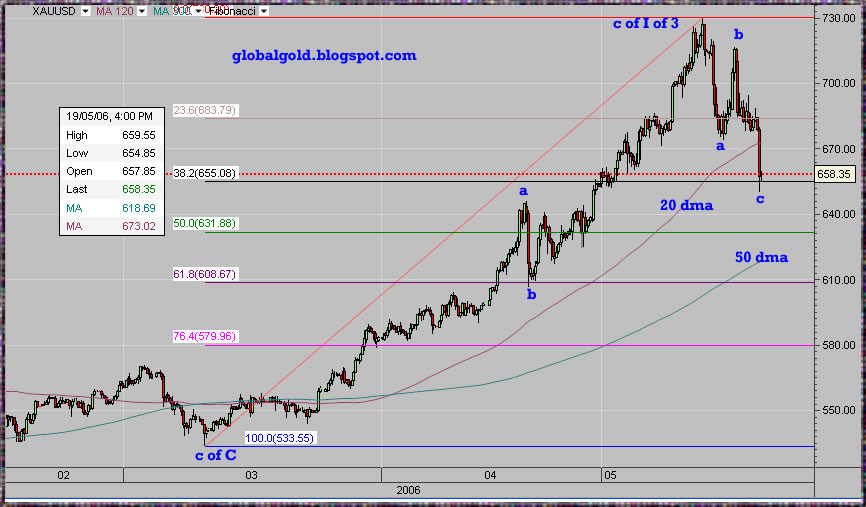
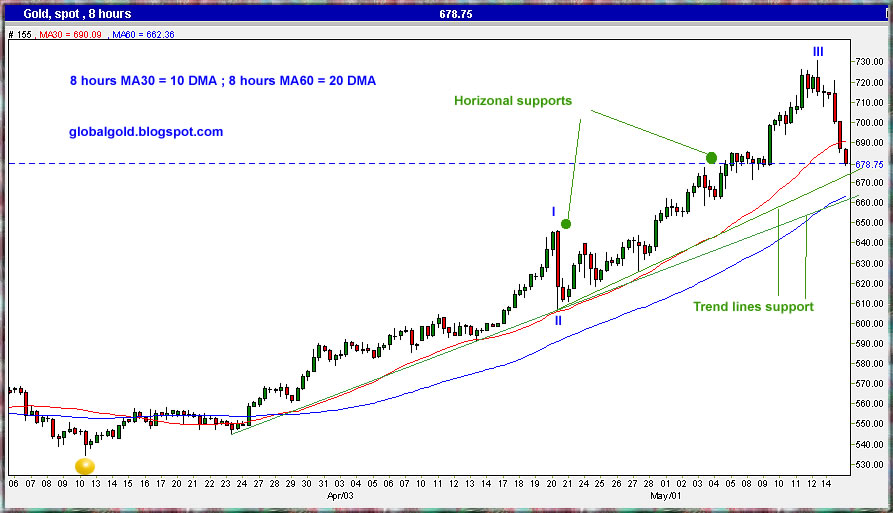
The gold price hit a bottom at ~674$ then rallied ~30$ , here is an Intraday spot gold chart with Fibonacci support lines , moving averages and trend line , there are numerous other technical indicators but I find this most useful. – this blog is focused mainly on the price of spot gold and silver , my other blogs are focused on commodities in general and gold , silver , metals mining stocks, If you are looking for an excellent capital markets & social equity blog I highly recommend Bill Cara.


Click on the chart below to enlarge:

XAU spot gold chart

Tuesday, May 16, 2006

Spot Silver Intraday Chart (XAG)

I have annotated 4 hours spot silver price chart with Fibonacci lines and selected moving averages, (4 hours MA = ~ DMA/6; MA 60 = 10 DMA …). In my opinion silver is consolidating under the ~15$ long term resistance area , once the consolidation is over expect the silver price to rally toward the 20$ level.

XAG spot silver intraday price chart

Monday, May 15, 2006

Gold Chart Update

Gold traders learned today what silver traders already know: under some market conditions and certain technical formations the gold market can do quick and sharp sell offs. The gold market is attracting more and more forex traders which are usually using high level margins (x10 , x20…). This sharp pullback has certainly cleaned some of the excessive short term gold speculations. Time will tell how long it's going to take for the gold price to make a higher high, in my opinion – not to long.

Here is six hours spot gold chart. The chart is annotated with two sets of Fibonacci lines, Elliott wave count and diagonal trend lines, click on the chart below to enlarge:


spot gold price intraday chart

Gold & Silver Sharp Sell Off !!

Gold, Silver, Metals, Oil and most of the commodities experienced a sharp sell off today. Is this the end of the Gold, Silver, commodities bull market? – I don’t believe so!
I do think that most if not all the commodities will head higher and one should concentrate on finding buying opportunities. This is exactly what I'm doing, adding to my positions from time to time when my free cash flow allow it.


If you need Free Real time quotes and charts for gold, commodities, forex and stocks (registration is required) try ADVFN

Here is an annotated intraday spot gold chart, you can click on the chart to enlarge.

Gold spot intraday chart

Saturday, May 13, 2006

Gold , Silver market update

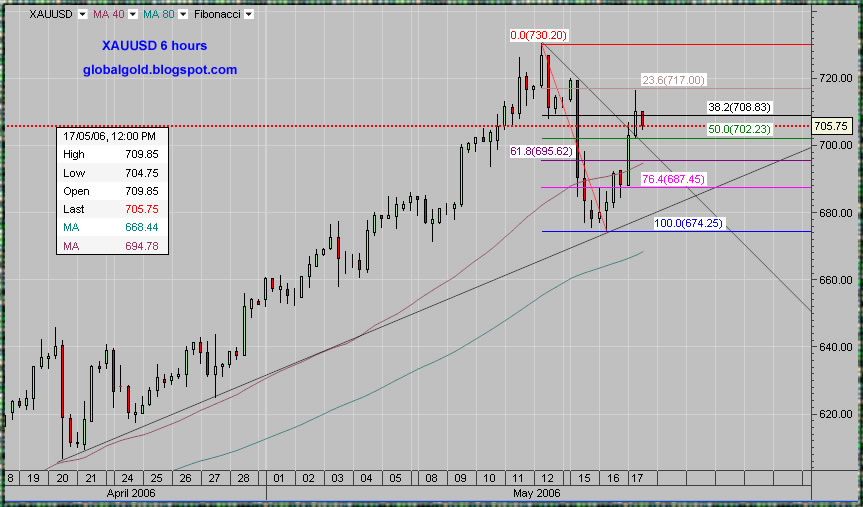
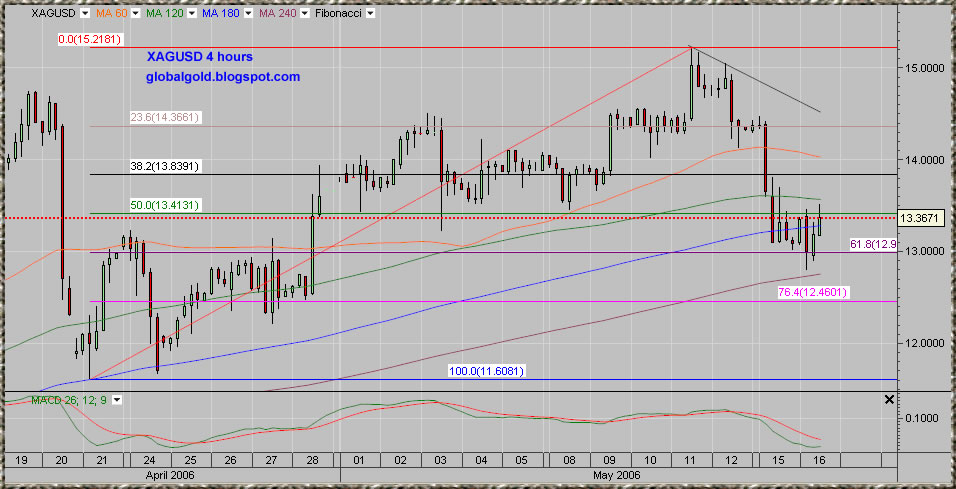
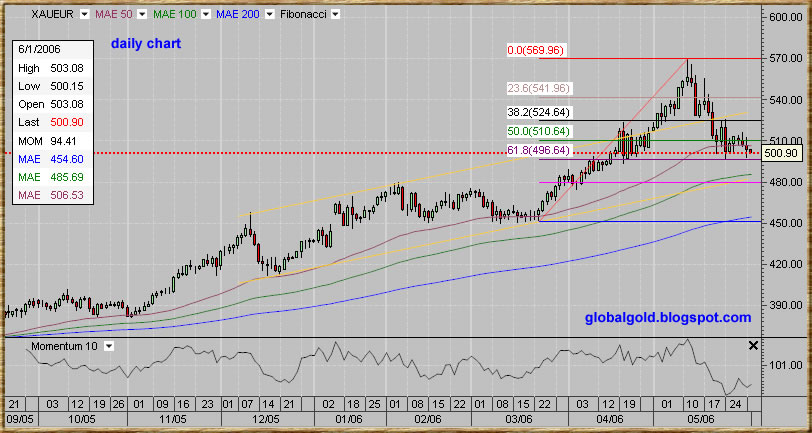
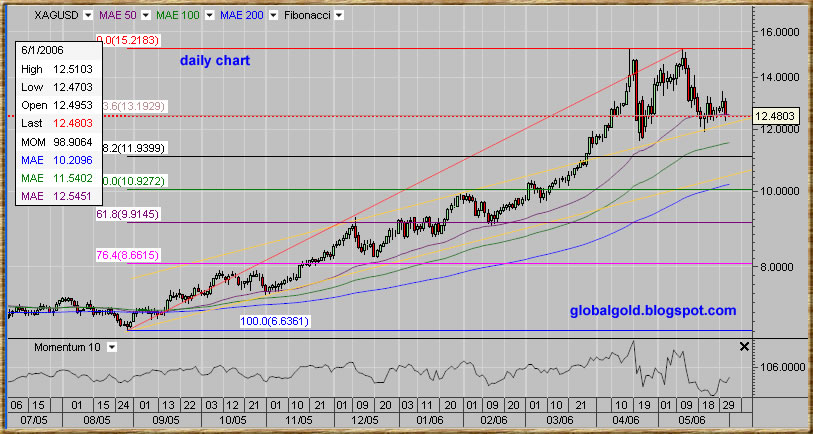
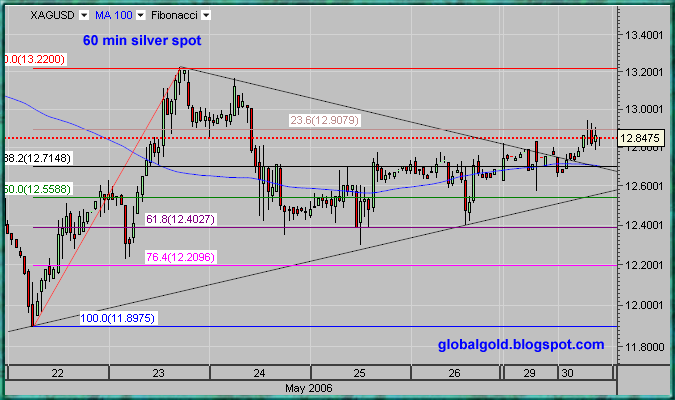
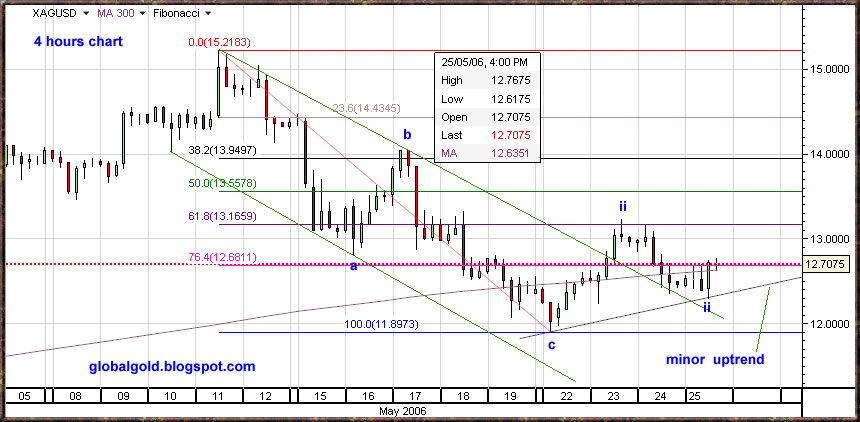
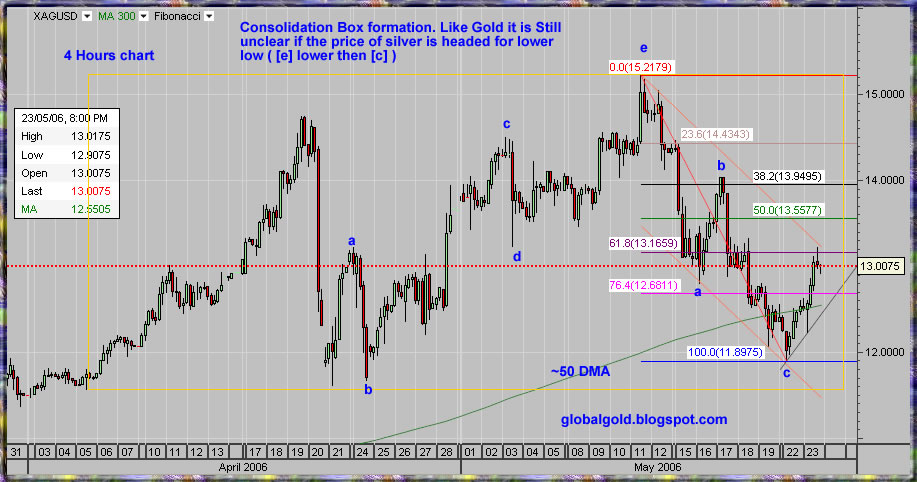
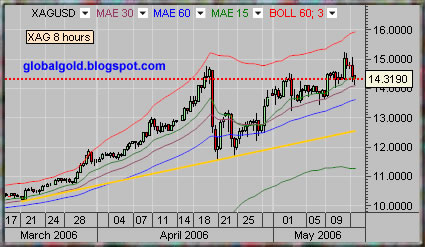
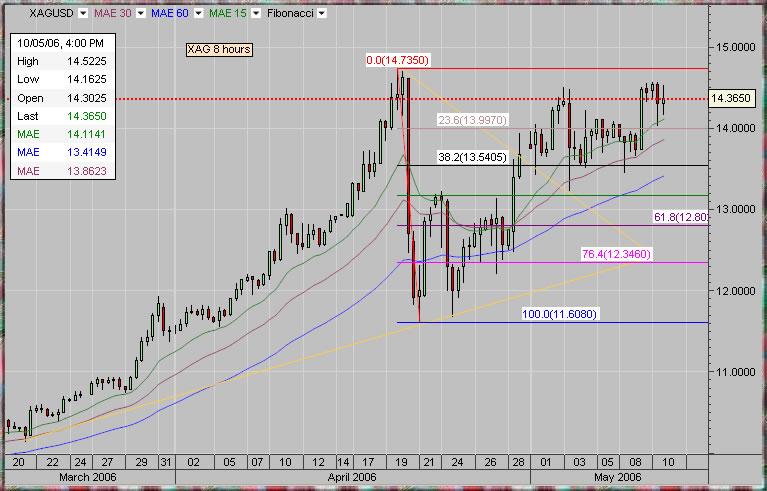
The Gold Silver ratio (XAU / XAG) = ~49.85, Dow / Gold = ~15.94, Gold / Oil (Light Sweet Crude) = ~9.92. Here are Spot Gold (XAU) and Spot Silver (XAG) intraday charts annotated with moving averages, trend lines and Bollinger bands.

XAU, Spot gold intraday chart

XAG, Spot silver intraday chart

Related :

Friday, May 12, 2006

Gold Price Predictions

Gold is marching upward, showing great technical strength. This is the Great Global Gold Bull Market, The gold market is subject to very large and complex amount of psychology. Ignore any publication / observation / commentary which try to call a top for the price of gold – this is foolishness at best.

No one knows how high the price of gold can go but the upside potential continue to be much greater then the downside. Gold can and will multiply in price in terms of most if not all national currencies. In my opinion the only reasonable prediction is that the price of gold is going to be unreasonably high in the future.

Gold is still recovering from the 1980 – 2000 bear market, the real gold rush will start once the price of gold makes an all time high / add another digit.

If you browse this blog archive you will find good information regarding the global gold market along technical analysis, important gold market news and interesting links to other resources related to gold. If you are interested with mining stocks see - Gold, Silver metals mining stocks, if you are interested with commodities in general see – Commodities Charts and Elliott waves. For Elliott wave analysis try Elliot wave international .

Wednesday, May 10, 2006

Gold Global Perspective update

It was another good day for the precious metals complex investors. The Gold Silver ratio (XAU / XAG) = ~48.99, Dow / Gold = ~16.47, Gold / Crude Oil = ~9.79.

Silver continue to consolidate just under the recent high, once the April high is taken the price of silver will face the 1983 high of around ~15$. The recent consolidation pattern will serve as good support in case of any pullback.


Spot Silver intraday chart


Gold, Silver, Platinum, Palladium, Copper, Aluminum, Crude Oil WTI, Natural Gas, Unleaded Gasoline & CRB Index charts. -link

Gold / Silver, Platinum, Palladium, Copper, Aluminum, Crude Oil WTI, XAU , HUI & CRB Index ratio charts. -link

Gold in terms of: Euro, Yen, Pound, Australian $, Canadian $, Rand, Frank, USDX. -link

Retail gold prices soar to hit 100-year high
CHAROEN KITTIKANYA

Local retail gold prices have hit an all-time high of more than 12,900 baht per one-baht weight (15.16 grammes) of ornamental gold.

Prices are now at their highest point in more than 100 years, driven up by global gold prices, which this week rose to a 25-year high of more than $700 per ounce, according to the Gold Traders' Association.

According to Pichaya Phisuthikul, the association's secretary-general, local gold prices rose yesterday by 300 baht, with the price of ornamental gold standing at 12,900 baht per one-baht weight, from 12,600 baht on Tuesday, and gold bar at 12,500 baht, a rise from 12,200 baht. -source

China Gold reserves

Beijing whispers push gold to $700By Ambrose Evans-Pritchard (Filed: 10/05/2006)
Gold has surged to $700 an ounce for the first time in 26 years after Chinese economists suggested the country should quadruple its bullion reserves to protect against a falling dollar.

Speculators have been alert to any sign that Beijing may be planning to switch a portion of its massive $875bn reserves into gold, a move that would electrify the market.

They seized on comments yesterday by Liu Shanen, an official at the Beijing Gold Economy Development Research Centre, who said China should raise the portion of gold in its reserves from 1.3pc today to between 3pc and 5pc. Such a move would entail the purchase of 1,900 tonnes of gold, equivalent to gobbling up nine months of global mine production.

Washington's cold response to Iran's move to defuse nuclear tension also helped fuel yesterday's rally. "No one is buying Iran's overtures," said Frank McGhee, a metals trader at Integrated Brokerage Services. "This is a purely geo-political move for gold. We've been here before. The difference is that this time, there are nukes involved."

June gold futures jumped $20.10 an ounce in New York, briefly touching the $700 line before falling back slightly.

Tan Yaling, an economist at the Bank of China, backed the call for higher gold reserves to "help the government prevent risks and handle emergencies in case of future possible turbulence in the international political and economic situation".

John Reade, a UBS analyst, said neither economist had any official role but hints were enough to drive prices in the current climate. "This is an investor frenzy, and China has become the biggest rumour in the gold world right now," he said.

Mr Reade said gold had changed stride since the middle of last year, the key moment when it broke out against all major currencies and began to attract investment from the big money brigade.

"Speculative and investment interest has replaced jewellery demand. The last time that happened was in 1979 to 1980," he said.

He said it was likely that Middle Eastern investors were switching petrodollars into gold after burning their fingers in local stock markets.

Ross Norman, director of the BullionDesk.com, said China may already be a silent buyer on the open market.

Central banks are supposed to record their gold purchases with the IMF promptly, but they have been known to move stealthily for months before declaring.

"This market has been bouncing back so quickly after each bout of profit-taking that it looks as if somebody big is trying to get in. It's too darn hot for my liking," he said.
Mr Norman said there was a fair chance that gold mining equities would start to play "catch-up". -source


Spot Gold Intraday chart

Monday, May 08, 2006

Gold / Oil ratio update

At February 10, 2006 I posted that I see a pattern of inverted head and shoulders on the Gold / Oil ratio chart. Since then the gold / oil ratio moved higher, closer to the pattern price target of ~ 11.50. Oil and Gold both moved higher but gold have outperformed oil (gained more percentage). At April 14 , 2006 I posted an oil chart - New all time high for crude oil (WTI) , and indicated a price target of 81$ per barrel of WTI crude oil. 81$ x 11.5 = 931.5$ per gold oz, this price target is less then one percent lower then the price target of 939$ per gold oz - which is based on the average positive rate of change for gold since the start of the second leg up (Elliott Wave III) of the great global gold bull market (GGGBM) – see Gold price prediction 2006, see also The importance of the Dow Jones / Gold, Gold / Oil & Gold / Silver ratios.

Gold / Oil ratio chart

Van Eck Seeks SEC Approval for Gold Shares ETF

What Is Driving Up the Price of Gold?

Interesting Article:

What Is Driving Up the Price of Gold?
Emilie Rutledge

Last week, oil has been trading at historic high prices, and oil futures on NYMEX have closed at over $75 per barrel. We have passed the northern winter spell, and have yet to move into the US driving or hurricane seasons. At this time of year, oil prices usually tend to dip in line with reduced demand, but this is clearly not happening.

If you factor in geopolitical concerns, such as instability in Nigeria and uncertainty over America’s intentions toward Iran, oil prices still have the capacity to rise further in coming months. China’s and India’s meteoric growth will mean that demand for oil will remain strong even if prices rise higher.

On a similar trajectory, gold prices have also been rising, and have increased by over 20 percent so far this year. Gold prices touched $680 per ounce last week, their highest levels since November 1980. Gold tends to be seen as a “safe haven” for investors when they fear other monetary assets will lose value, often because of inflationary pressure or threat of war...source


Cat Scrap

source : minebox.com

Friday, May 05, 2006

Gold & Silver chart update

Gold simply wants higher while silver consolidate at the 12.50$ - 14.50$ range.
Platinum is already trading above the 1980 high.
Gold Silver ratio (XAU / XAG) = ~ 48.81, Dow / Gold = ~ 16.93, Gold / Oil = ~9.73.

Click on the charts below to enlarge:

gold price chart

silver price chart

Wednesday, May 03, 2006

Gold XAU 666 Commentary

Gold, Silver and other precious metals like palladium and platinum continue to show excellent performance. Gold cleared the 666$ mark with success that few predicted.
Most gold market commentaries continue to try and explain the roaring price of gold with non direct gold market factors like the Iran conflict and the USDX weakness.

It is reasonable to assume that the Iran issue does have some gold market psychology effect and the outcome is higher short term demand for gold. However this factor is psychological by large and difficult to quantify.

The USDX is completely different factor with longer term structural implications. The correlation between a weakening or potential weakening USDX and rising gold price is losing significance at this stage of the great global gold bull market (GGGBM). The price of gold have recently gained nicely when measured with each and almost every national currency (Gold vs. X)

In the same time direct gold market factor - the relatively large gold short positions that some of the gold mining companies ( Barrick gold ABX, AngloGold Ashanti AU) and other market participants are holding are hardly mentioned. I have mentioned these issues in the past couple of months and you can see more information by searching this site archive. If you are interested in more information regarding internal direct gold market factors I recommend reading the Cheuvreux gold report, the BIS OTC derivatives report as well as this very short Open Interest summery (OI). For those with TA orientation I suggest concentrating on the long term gold charts and using Elliott Wave principle which can at least give a good methodology for mapping of the gold price behavior on different time frames. Elliot wave counting can also improve and enhance the gold price prediction ability especially when combined with Fibonacci series and other technical analysis tools.

Technically short term continued extraordinary strength of impulsive extensive third up wave, not much resistance to be found. As mentioned the secondary b high of September 1980 is worth watching, Now that 666$ price is cleared next obvious psychological upside level is 777$.


Gold spot XAU chart


Suggested books:

Applications of Fibonacci Numbers : Volume 6

Fibonacci and Gann Applications in Financial Markets : Practical Applications of Natural and Synthetic Ratios in Technical Analysis

Elliott Wave Principle Key to Market Behavior

Liar's Poker: Rising Through the Wreckage of Wall Street -Insightful & Funny

Search

SUBSCRIBE

Gold Global Perspective Feed

AddThis Social Bookmark Button AddThis Feed Button

Archive

Labels