Friday, March 31, 2006

Gold and silver charts

Gold is trading at price not seen for 25 years; Silver is trading at price not seen for 22 years. When the historical perspective is taken in account the precious metals market is really exciting right now. Caution is always advised to those who hold margined positions, especially in silver which is clearly in a parabolic phase. However, silver does not face much technical resistance all the way to 15$. Obviously the higher risk is always on the short side for both gold and silver. I have annotated the gold chart with a new trending channel, silver is parabolic and I can't draw a short term channel.
There is no need to update the Gold / € & Gold / ¥ since the short term chart is very similar to Gold/$. Gold is trading against the major currencies with great strength like a currency of first choice, considering the fundamentals and the historical perspective this is not surprising at all.


Long term gold and silver charts

GG (Goldcorp Inc.) , ROYAL GOLD INC (RGLD) , Pan American Silver Corp. (PAAS),SILVER WHEATON CORP (SLW) reviews.

Silver chart XAG
Gold chart XAU

Thursday, March 30, 2006

Gold @ new multi year highs

Finally gold succeed to follow the price of silver and surpass the 2006 Feb peak. Silver continue to climb faster then gold, the XAU / XAG ratio around 50.5.


Time for Gulf economies to increase gold reserves

By Dr. Eckart Woertz
Commentary by
Thursday, March 30, 2006
"but the central banks of the region have not shown the same amount of foresight yet. Their gold reserves are very low, both on an absolute and a relative level. Four countries - the U.A.E., Oman, Qatar and Bahrain - have sold out nearly all of their gold while Kuwait has leased out its complete reserves with uneasy prospects of return, should third parties default."

XAU chart
Silver XAG chart

See GG (Goldcorp Inc.) , ROYAL GOLD INC (RGLD) , Pan American Silver Corp. (PAAS),SILVER WHEATON CORP (SLW) reviews here

Wednesday, March 29, 2006

Gold , $ , € , ¥ & Silver

Gold broke up against the upper diagonal downtrend line, in addition it now trades above the { B }high. Gold in terms of USD, EURO & YEN is trading in a correlated fashion. Silver continue to go higher making new multi years day after day (long term silver charts).

gold and silver stocks reviews


Click on the charts below to enlarge

 Gold $

 Gold €

 Gold ¥

Gold silver ratio [ _XAU/_XAG + _XAU]

Rising silver price as opposed to crashing silver price 2004-01 April, relatively low gold: silver ratio and potential typical bullish consolidation pattern are all supportive of higher gold price. Click on the charts below to enlarge:


XAU
XAU / XAG

Monday, March 27, 2006

Gold / $,Gold / € & Gold / ¥ [update]

Gold continue to show strength and to perform against all the three major currencies. The upper downtrend line is broken for Gold / Yen , Gold / USD & Gold / Euro currently struggling against the upper downtrend lines. There is some overhead resistance around recent highs, likewise good support at appropriate Fibonacci levels. Click on the charts below to enlarge:

Gold / $ intraday chart


Gold / € intraday chart

Gold / ¥ intraday chart

Gold and Silver news

Gold is currently trading higher then Friday high. Silver is also higher, making a multi year high again...

As I posted a several time in the past: each and every self respected exchange will soon offer gold and silver trading / saving instruments. Here are some of the important news which directly effect gold and silver:


Dubai commodity bourse to begin silver futures trading today
Dubai: The DGCX Silver Futures Contracts, to be launched today, will be a 1,000 troy ounce contract with maturities in March, July, September and December each year.
On maturity of a futures contract, the open position would be settled through delivery of 30 kg silver bars from 10 approved brands complying with Dubai Good Delivery standards. source


Taiwan gold futures end firmer on first day
TAIPEI (Reuters) - Taiwan's first gold futures contract closed firmer on the first day of trade on Monday, with investors watching to see if volumes would be high enough to attract continued interest.
The most active June contract closed at US$564.1 per ounce, off an intraday peak of $572.2, but up from an open of $550.0 an ounce on volume of 278 lots. source


It is extremely bullish when a multi bullion guaranteed free cash flow entity (like the CB of china) has a buying interest in your saving asset :

China should tap FX reserves to buy gold
BEIJING, March 27 (Reuters) - China should use part of its fast-growing foreign exchange reserves to buy gold as it seeks to adjust the asset mix to hedge against risk, a Bank of China official was quoted on Monday as saying.

Analysts say China has been gradually diversifying away from the dollar -- although fears of a collapse in the U.S. currency will prevent any dramatic shift. Chinese officials have denied reports they plan to sell current dollar assets in the reserves.

"China should appropriately reduce the proportion of dollars in its foreign exchange reserves while increasing the proportion of currencies such as the euro," the Financial News quoted Wang Yuanlong, a director at Bank of China's Australian operations, as saying.

"We can use part of the foreign exchange reserves to buy gold, which would help make the reserves more diversified and help guarantee and increase their value," said Wang, former economist at Bank of China, the country's largest foreign exchange bank.

China's foreign exchange reserves swelled 34 percent in 2005 to a record $818.9 billion, but the central bank has not disclosed the composition. source

Saturday, March 25, 2006

Gold spot powerful action (possibly [c of C] bottom reaction)

Gold emerged from what I assume to be [c of C] simultaneous bottom for Gold / USD, Gold / Euro & Gold / Yen Exchange rates(see the post from two days ago). A pure and powerful technical move which propelled gold higher, closing at a two weeks high just 15$ (less then 3%) lower then the multi years high.

Click on the chart below to enlarge gold spot eight hours intraday chart annotated with the two most relevant sets of Fibonacci lines:


Gold spot candles chart

Friday, March 24, 2006

Gold and silver Intraday charts

Not much change, silver continues to break into new highs, gold consolidating and enjoys just a slight uptrend. Click on the charts below to enlarge:

Gold intraday chart

Silver intraday chart

Thursday, March 23, 2006

Gold / USD, Gold / Euro & Gold / Yen Exchange rates charts

Yes! The Silver break out continue, Spot silver currently trading around 10.65 $ per 1 Oz.


Year of the dog silver coin

However, I will like to concentrate on silver bigger brother = Gold.
Gold is looking a bit tired but it seems comfortable at ~550$, ~455€, ~64,000¥.
The price of gold in terms of US Dollar, Euro and Yen is nicely correlated and the wave count is very similar.


Click on the charts below to enlarge Gold / USD, Gold / Euro & Gold / Yen Exchange rates charts annotated with two sets of Fibonacci levels and Elliot waves counts:

Gold USD

Gold Euro

Gold Yen

Wednesday, March 22, 2006

Silver and gold

Yet another new multi years high for silver, gold is still lagging behind, trading around the 550$ level. Gold and silver mining stocks continue to disappoint investors. As I previously posted a several times: Investors preferences are changing and the metals could and should outperform most of the mining stocks. This great global gold & silver bull market is different from the 1970 – 1980 bull market for many good reasons. Investments and trading strategies that worked back then might not work at present. I continue to believe that most Investors should continue to buy and hold physical gold and silver. I'm holding the opinion that investors should allocate a much larger part (then most "experts" advice) of their saving portfolio to physical gold and silver. It is my opinion that gold and silver should account for not less then 25% of one savings. In the future I will write more about Investments strategies and tactics for this great global gold and silver bull market.

Click on the charts below to enlarge:

Spot silver chart

Spot gold chart

Sunday, March 19, 2006

Gold spot (xAU) Elliot wave count

Is the gold correction over?

Here is my latest Elliot wave count for gold spot, the count cover the second major wave up (Elliot wave III) from its beginning to date, the count implies that gold is currently having some kind of a minor correction which could well be over. The third wave has a long way to go and gold is headed much higher. Short term gold traders should concentrate on the latest high, low and Fibonacci levels shown on the second chart. As the wave progress I will update this count occasionally.


Click on the charts below to enlarge:

gold chart


gold spot


Belarussian National Bank to increase gold reserves to 32 tonnes
MINSK. March 15 (Interfax) - The National Bank of Belarus plans to set up a gold reserve of at least 32 tonnes of gold equivalent by 2011, a source in the main precious metals and stones department at the National Bank of Belarus told Interfax.

Friday, March 17, 2006

Gold spot intraday chart annotated with Elliot wave count

I have annotated a four hours gold spot intraday chart with Fibonacci retracment lines and Elliot wave count. The short term outlook for gold is still foggy but the chart doesn’t look that bad and the silver action is very positive sign for gold, actually silver is currently climbing higher to new multi decades highs.

click on the chart below to enlarge:
Gold spot

Wednesday, March 15, 2006

Gold and silver charts

Or should I say Silver and Gold?

Silver continue to lead on the upside making another multi decade high while gold struggle to hold support. The precious metals market is changing at least temporarily and In my opinion silver currently enjoy better physical demand then gold. In addition some market participants are expecting the silver ETF as well as long silver short gold trades. Both metals can have some short term pullback anytime and silver is certainly more risky and volatile. However both the silver and gold markets continue to present a superior high reward low risk investment opportunity, regardless of geopolitics and minor economic events. Short term gold is forming a triangle pattern and a relatively powerful break (up!? / down?) Will soon follow…

Click on the charts below to enlarge:

gold spot intraday chart
silver spot intraday chart

Tuesday, March 14, 2006

Silver , China and Swiss.

As the GGG&SBM advancing and gold and silver are loosing some of their "bad" investment stigma expect more and more precious metals investment vehicles as well as broader public participation. It will not be long before each and every exchange will offer gold traded funds. Today the Swiss Exchange is lunching a physical gold ETF under the symbol ZGLD. (source).

Meanwhile on the silver front :
Shanghai Gold Exchange is preparing to start silver trade, which will set the benchmark for Chinese prices, industry sources said on Friday. The new product could increase China's investment demand for silver and reduce its exports, they said. China exports about two-thirds of its silver production.


For anyone who is looking for Free real time quotes for the futures, stocks and Forex markets. I suggest you checkout ADVFN:FREE Real Time Quotes

I also suggest trying this interesting trading software which is based on AI ( Neural Network),Download TradingSolutions


I have annotated a daily chart of spot silver with Elliot wave count and trend lines, click on the chart below to enlarge:

silver spot chart & elliot wave count

Monday, March 13, 2006

Gold Intraday chart

There are some pierce and possibly leveraged tactics to play the great global gold bull market.(GGGBM) : One can short the gold futures at the NYMEX and go long the physical metal. April 2007 Futures are trading at 571$ so anyone who is able to short the futures and take a couple of gold bullions "home" at a slight commission can make an arbitrage trade. I believe this kind of trade is very popular and the outcome will be higher real gold prices with a possible malfunction of the paper gold market.

One way or another the yellow dog is going to bite and bite hard…. Currently I see heavy accumulation, the gold chart looks bullish and the minor down slope is to be ignored. Also ignore Inflations, Interest rates and Officials speaks. Most common people are going to buy gold at four digits and higher. This is my opinion.

gold spot chart

Thursday, March 09, 2006

Gold and Silver

Not much to say about the action in the precious metals market today. Gold and silver consolidate, silver is still in a strong uptrend while gold might defined a new (less steep) channel. I have to look deeper and see about the Elliot wave counts for both silver and gold. This way or that way, the technicals and fundamentals are still implying for much higher gold and silver prices. Occasional washouts are a must though...


Click on the charts below to enlarge:

silver spot chart
gold spot chart

Wednesday, March 08, 2006

Gold and terror

Never buy gold because of terror / pandemics … Fears, if you are subscribed to doom theories then the US dollar will serve you better.
I try to keep my political and religious opinions out of this bog as much as I can for the reason that gold is the money of ALL common people. However, I must say again that it is silly to think that a small minority, fanatic group – so called terrorist or self destructing regimes in specific countries can control the price of gold (the forex of nature). More then this, it is very possible to think that terror attacks have just the opposite affect on the price of gold. That is: terror = declining price of gold. Like wise growth and economic prosperity will probably bring higher gold prices.
Gold is first of all a chemical element in the periodic table and that a scientific fact. Since gold like any other commodity offer nothing but price appreciation or relatively independent store of value – It is very hard to buy it when it price decline and 77% of the market comments are bearish.

If I have to guess, what are the reasons for the sharp decline that brought the price of gold back to its 2005 high level?
This is what my instinct tells me: The gold market needed a good washout in order to get rid of the short term virtual gold speculators which trade somewhat false paper promises based on geo-politics, fears and other psychology related opinions.
Technically the four month trend lines broke down and nominally you can almost buy gold now at last year price, isn't it wonderful?

Click on the chart below to enlarge:


Meaningless to the gold market , meaningful for Ghana:
Ghana 2005 gold output up 20%
Accra - Gold production in Ghana rose 20% last year to 2.15 million ounces as established companies raised production and new mines came on line, figures from the Ghana chamber of mines showed on Wednesday.
Gold producers' revenues from Ghana, Africa's second biggest gold producer after South Africa, rose 24% to $903.9m in the same year, the chamber said, reflecting a rise in prices of the precious metal to near 25-year highs.

Tuesday, March 07, 2006

Gold and Silver, Virtual vs. Real

Genesis 13:2 (New International Version)
New International Version (NIV)

"Abram had become very wealthy in livestock and in silver and gold."

The last couple of trading days gold and silver lost some synchronization, while both sharply declined yesterday silver quickly based around support but gold drifted lower.
In my opinion a good reason for this could be the real vs. virtual metals issue. As I wrote already a couple of times - I think that Investors preferences are changing at this stage of the Great Global Gold (& Silver) Bull Market (GGGBM or GGSBM). Not all gold holdings are equal, for example a 1 oz gold coin in your hand does not equal 10 GLD shares in your broker account. I have been long saying that Investors (especially small investors) should own physical metals (preferably at home).

Don’t get me wrong , If for some reason your only way to invest in gold is a gold fund then it better then nothing, but If you can choose between 10 gold coins and 10,000$ in a gold fund I will definitely choose the gold coins.
There is much to say about real vs. virtual metals and obviously I cannot cover this entire subject in one day. One more point – It's not black or white it is more like a real vs. virtual scale. So what I see in the market is this: Investors are loosing some appetite for Precious metals stocks and for now they find confidence in buying silver coins. I will soon write more about this issue but for now Silver is set to lead but the out look for gold continue to be positive.

For HUI(AMEX Gold Bug Index) chart click Here

Click on the charts below to enlarge:

gold spot
silver spot

Monday, March 06, 2006

LSE to launch silver tracker fund

Virtual silver fund, bulls get a bit disappointed...

By Kevin Morrison
Published: March 6 2006 17:44 | Last updated: March 6 2006 17:44

A silver price tracker fund, also known as an exchange traded fund, is expected to be launched on the London Stock Exchange within the next month by ETF Securities, which has already launched an oil-backed ETF on the LSE.


The planned new investment product is separate to the silver-backed ETF filed by Barclays Global Investors with the Securities and Exchange Commission, which is expected to make a decision shortly on the proposal.

It is understood that ETF Securities has approval from the UK’s Financial Services Authority. ETF Securities is controlled by Graham Tuckwell, who listed the world’s first commodity-backed ETF when he launched Gold Bullion on the Australian Stock Exchange three years ago.

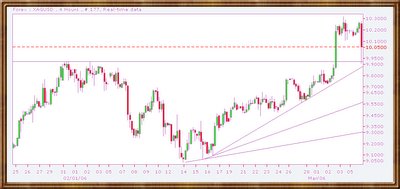
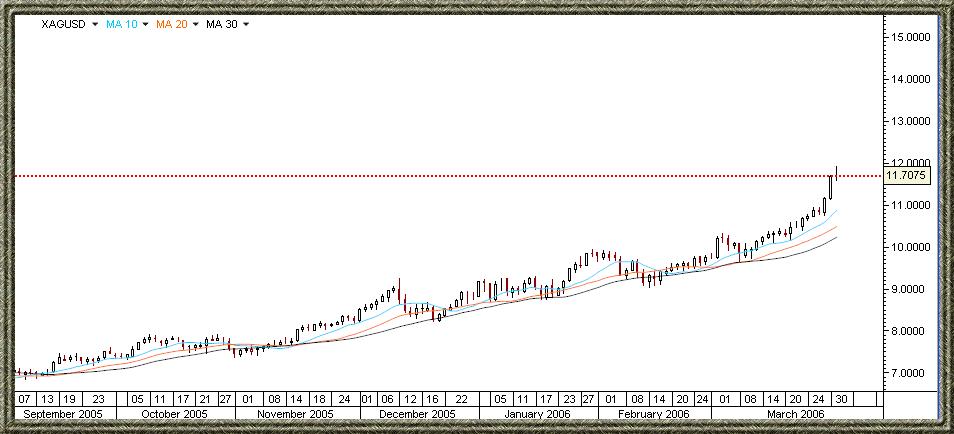
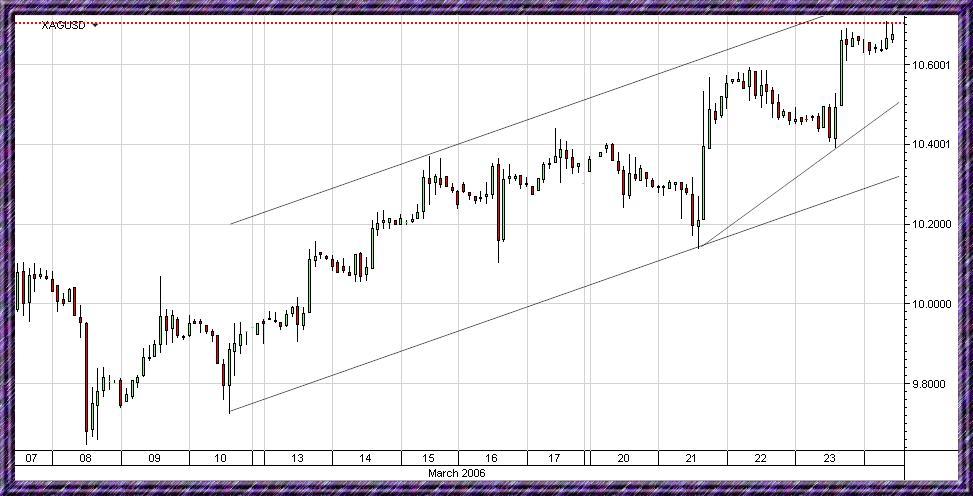
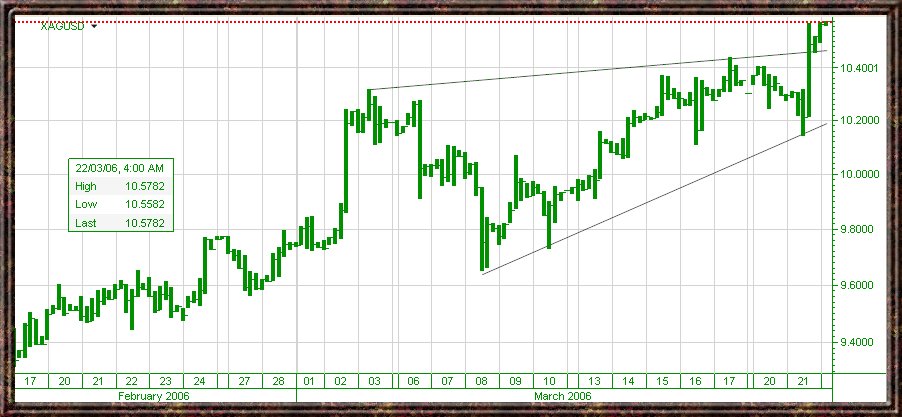
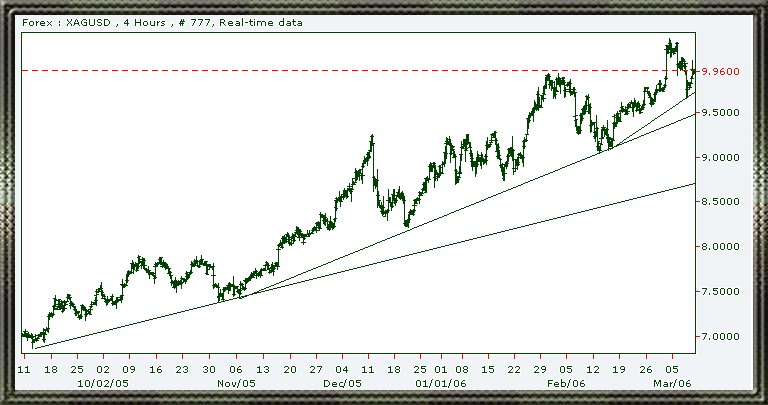
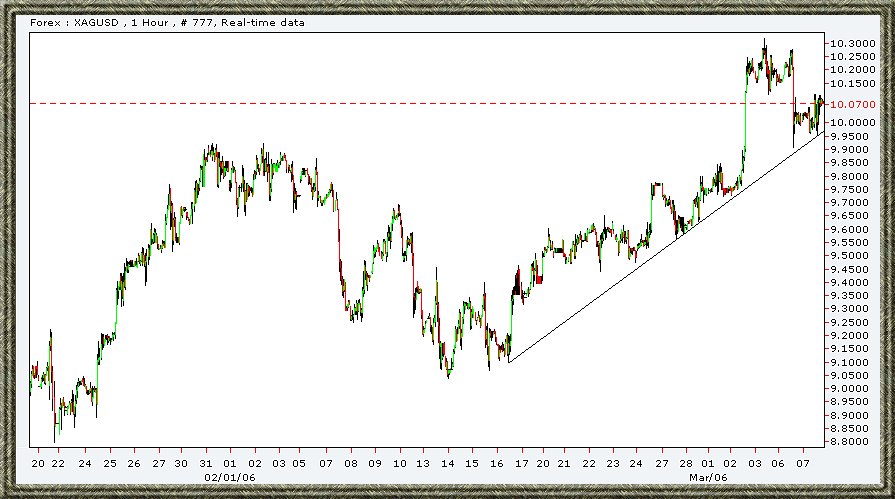
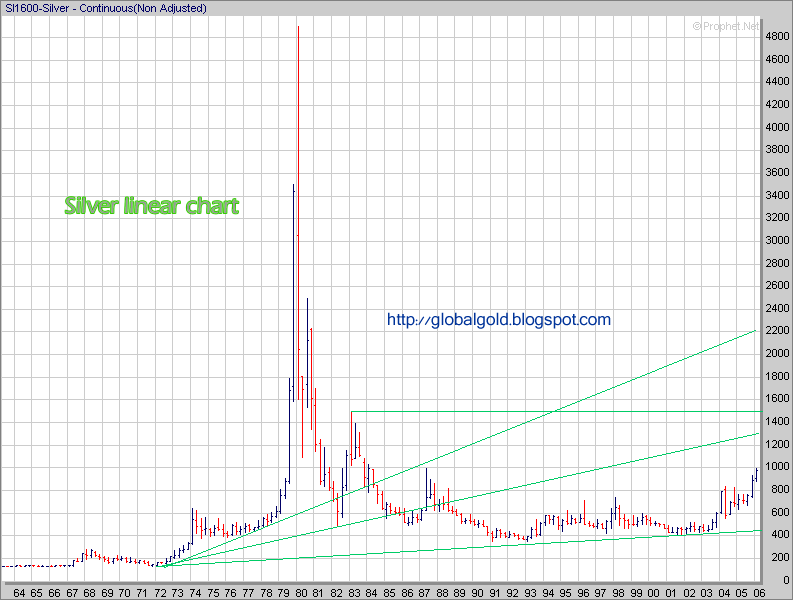
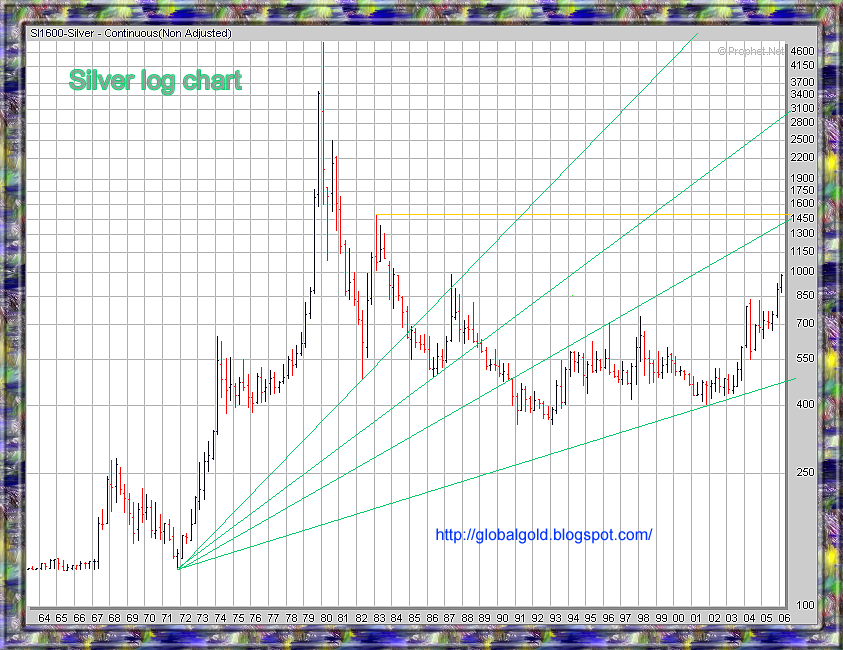
Silver prices closed at a 22-year high last week, and were trading at $10.25 a troy ounce in mid-afternoon trade in London, up 7 cents from Friday’s close.

Expectations of a launch of a new silver-ETF in the US have been a key driver behind the recent surge in the silver price, which has risen 60 per cent since the start of 2005. Once fully issued, the proposed BGI silver ETF would require the purchase of 130m ounces of silver, according to the fund’s prospectus.

However, few have factored in the possible listing of a silver investment product in London.

Unlike the various gold and oil backed ETFs and the BGI initiative, the proposed silver fund in London will not be physically backed by the underlying commodity.

The funds raised by the proposed London listed silver ETF would not be spent on buying the metal, but the performance of the fund would remain linked to the silver price. Funds raised by existing commodity-backed ETFs are spent on buying the physical commodity, which adds to the increase in demand.

Advisers to ETF Securities have warned that demand for a silver ETF could distort prices and affect demand as the silver market was too small to support large amounts of the metal allocated to investors. This is an argument used by the Silver Users Association in its opposition to the proposed US silver ETF.

“We do not have to look back very far to see the impact a significant amount of allocated silver would have on the market. It was 1998 when Warren Buffet purchased over 100m ounces of physical silver and the spot price rallied over $3,” it said.
source


 spot silver chart

Sunday, March 05, 2006

What is a fair price for gold ?

It is my opinion that a fair price (or better said an exchange rate) for gold is the gold spot price which is constantly changing. It might seem simplistic but I have come to this conclusion after deep and prolonged thinking. The spot price for gold is a reflection of the aggregate forces which are active or inactive in the market, this is the price where the buyers and sellers meet and trading take place.

So basically I think that under current conditions it's a waste of time to try and calculate a "fair" price for gold which is based on one set of data or another.
However, if one is interested in gold I wish to offer the following issues:

1) What is gold?

2) How to measure gold? (Purity and weight)

3) Ratios which allows a non currency dependent comparison between other assets and gold: Gold and Oil ratio I , Gold and Oil ratio II , Gold / Silver exchange rate, Dow / Gold ratio.

4) What are the drivers behind the price of gold?

During the last couple of years I have devoted considerable amount of time studying this issues and the relations between them, my conclusions are as follows:

1) Gold is often misunderstood, gold is a subject for love and hate, fear and greed, richness and poverty – gold is a subject for mixed and contradicting emotions. The amount of psychology involved with gold is endless.

2) The word speculations and speculators are often attached to gold. Gold is also "virtually" traded within the Forex and futures markets as such gold is often traded in an extremely leveraged and margined manner. However another perspective for speculation and gold which is rarely discussed is the fact that gold is heavily shorted by some market forces. There is a possibility that the total outstanding positions in gold are greater then all gold in existence. This is long term speculation from the sell side which might have sold more gold then they own or worse – they might have sold more gold then they can get. This possibility encapsulates a potential for the biggest short squeeze in history.

3) Gold is traded, bought and sold for many different reasons and different forms. The following diagrams illustrate:


paper Gold vs real gold

That’s it for now.

Friday, March 03, 2006

Gold and silver 4 hours charts

It was a good week for gold and silver. Silver made a new multi decade high while gold lagged a bit and it's still trading a zit below the January high. Silver had a spectacular run yesterday and caution is advised for those holding a margined silver position, Silver can run much further but it can also pullback and consolidate around support. I would like to see gold confirming the silver new high next week
So, to sum it up, short term, Silver is more risky then usual (for short term trading) as long as gold has not confirmed and made a new high.

Click on the charts below to enlarge :


SA gold production lowest since 1923
By: Gareth Tredway
JOHANNESBURG (Mineweb.com) -- South Africa’s gold production in 2005, was its lowest since 1923, at 296.3 tons, according to a statement from South Africa’s Chamber of Mines released on Friday.
In 2004, 342 tons were produced. source

Thursday, March 02, 2006

Silver long term charts

What a $ilver day!

Strikes that shut most Mexican mines and a bullish inverted head and shoulders pattern fueled an impressive rally of 0.50$ , that’s the first time in 22 years that silver is trading above 10$ per oz . I see this event as a major bullish sign for both silver and gold, silver is finely trading at double digit figure. Gold had a good day but a bit boring compared to the silver action, the gold / silver ratio declined sharply.

Click on the charts below to enlarge

silver long term chart linear

silver long term chart log

gold silver ratio chart

Silver SPOT (XAG)

Keep your eyes on silver, there is an inverted head and shoulders pattern on the intraday spot silver chart with an initial target of well above 10$. As I wrote before the days of single digit silver will soon be over.


Click on the chart below to enlarge:

 spot silver chart

Wednesday, March 01, 2006

Gold in Euro and China...

I see a possible head and shoulders pattern on the intraday gold euro spot chart.
The price target should be ~493 Euro per one gold OZ.


Click on the chart below to enlarge:


gold euro spot chart

China Leads From The Front By Doubling Its Gold Reserves This Year

Interesting to read that the National Development and Reform Commission has stated that China intends to more than double its gold reserves to 1,270 tonnes this year. According to figures released recently by the World Gold Council on official gold holdings this will put it on a par with Switzerland in 6th position. In 2005 China increased its gold reserves by 20 per cent to 620 tonnes and now it is going to add a further 650 tonnes. Down at the bottom of the list, or very close to it, is the poor old UK with a paltry 311.2 tonnes thanks to the devious machinations of Chancellor Brown. On one side is Venezuela and just below is Belgium – not the usual place for a once proud empire. And what about Australia, Canada and South Africa, the three countries which traditionally prided themselves on their mining. None of them feature in the Top Twenty gold holders.

China still has some way to go to catch up with the US which is said to have 8,133.5 tonnes of gold stored in Fort Knox. The word ‘said’ is introduced deliberately as the gold depository at Fort Knox is a classified facility. No visitors are permitted, and no exceptions are made. Back in the 1970s a man named Edward Durrell claimed that substantially all of the US Gold Reserve being stored at Fort Knox had gone. A modest amount remained, but the rest had been shipped to London in 1967 and early 1968 for sale by President Johnson in an ill-fated attempt to keep the price of gold at US$35 per ounce. Since then there have been variations on this story and the sad thing now is that the US government retains so little credibility that no one knows what to believe. source

Search

SUBSCRIBE

Gold Global Perspective Feed

AddThis Social Bookmark Button AddThis Feed Button

Labels