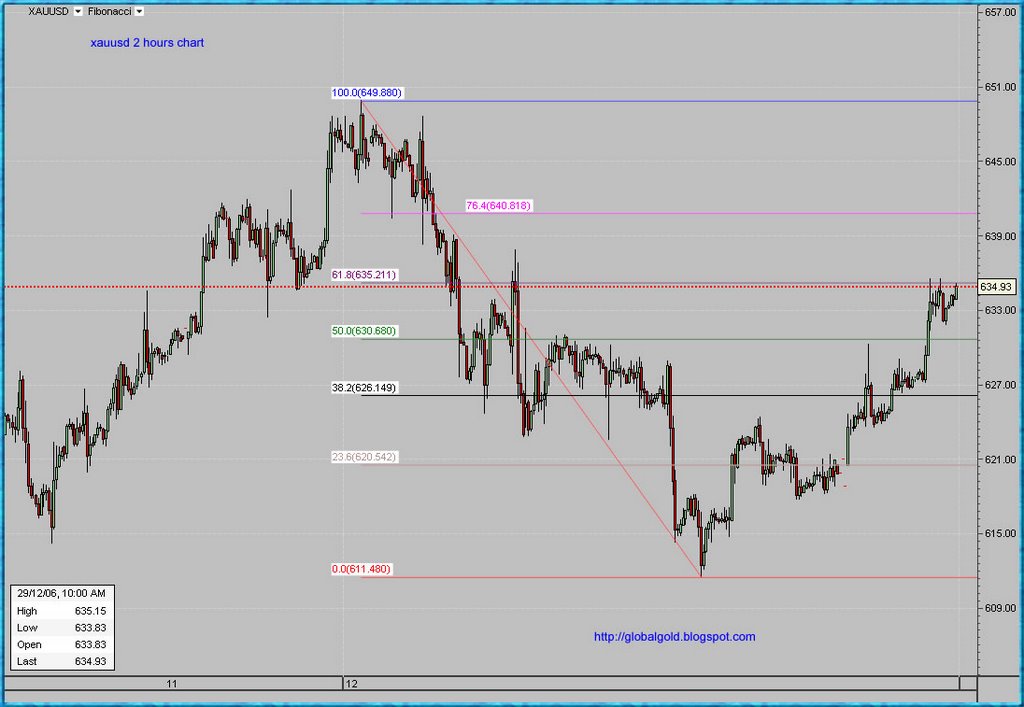
The year is coming to an end and volume is low , meanwhile gold managed to retrace to the 61.8% Fibonacci line of the latest 38$ correction. An up to date intraday chart with Fibonacci lines is posted below.
I keep a blog about gold, and I think my readers would find your blog very useful as well. I will add you blog to my links list. If you feel my blog is suitable, please link back.
Does that mean that a retest of 611 is coming in the next few days/weeks?
ReplyDeleteNo, a retest of $ 649,88 and a breakout above.
ReplyDelete611 and then some!
ReplyDeletewhere to now?
Crude to $33?
hmmm....
probably means it's that time again....
time to start buying.....
"No, a retest of $ 649,88 and a breakout above."
ReplyDeleteI wrote before.
It's now here and now, spot just hit $ 658! So what if it went down before to $ 601, its a setup for a "bullish catapult"!
Excellent blog! I've found it very informative.
ReplyDeleteI keep a blog about gold, and I think my readers would find your blog very useful as well. I will add you blog to my links list. If you feel my blog is suitable, please link back.
http://the-gold-market.blogspot.com
Regards
Paul